- Mark as New
- Bookmark
- Subscribe
- Mute
- Subscribe to RSS Feed
- Permalink
- Report Inappropriate Content
Hi,
I ran the latest version of Platform Profiler with the Optane DC Persistent memory in Memory mode and uploaded the result file to the platform profiler webpage (localhost:6543).
In Memory view, I can see the 'Read Hit Ratio / Write Hit Ratio' graphs in 'Persistent Memory Traffic (per DIMM)'.
But What is Read Hit Ratio / Write Hit Ratio?
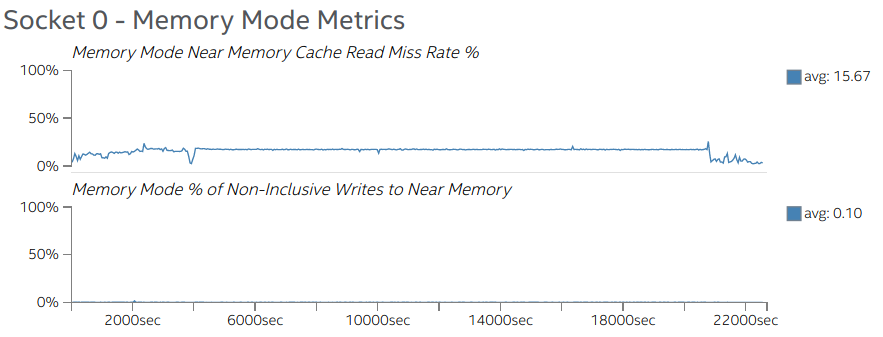
Memory mode metrics (read miss rate of DRAM Cache) are already shown separately in Memory view.
Also, what is '% of Non-Inclusive Writes to Near Memory' in Memory mode? I'm guessing this is writes which are evicted from CPU LLC (Last-level cache) and entering DRAM Cache. Is this correct?
Q1. What is Read Hit Ratio / Write Hit Ratio in Persistent Memory Traffic (per DIMM)?
Q2. What is % of Non-Inclusive Writes to Near Memory?
Best regards,
Minjae Kim
Link Copied
- Mark as New
- Bookmark
- Subscribe
- Mute
- Subscribe to RSS Feed
- Permalink
- Report Inappropriate Content
Hi Minjae Kim,
read_hit_ratio : measures the efficiency of the buffer in the read path. Range of 0.0 - 0.75.
write_hit_ratio : measures the efficiency of the buffer in the write path. Range of 0.0 - 1.0.
0.75 : indicates 100% sequential read or write traffic > 0.75 : indicates writing to 64B addresses that are still in the Write Buffer (never had to go to media) 1 or ~1 : likely writing to a specific address or small range of addresses (fitting in write buffer) for long periods of time.
% of Non-Inclusive Writes to Near Memory: This metric gives the ratio (in percentage) of non-inclusive writes going to the near memory cache (DRAM) compared to the total number of writes going to the near memory cache. Non inclusive writes (cache line not present in near memory) are costly compared to inclusive writes (cache line present in near memory).
- Subscribe to RSS Feed
- Mark Topic as New
- Mark Topic as Read
- Float this Topic for Current User
- Bookmark
- Subscribe
- Printer Friendly Page


