- Mark as New
- Bookmark
- Subscribe
- Mute
- Subscribe to RSS Feed
- Permalink
- Report Inappropriate Content
Hi,
I am using vtune_amplifier_xe_2013 at a remote machine over a command line interface. In order to analyze the data in gui , I move the results to my local machine.
However, on openning the results in gui on a local machine, the hardware event counters are different than the counters in the summary of the cl report(conters like CPU_CLK_UNHALTED.THREAD, etc). This number is significantly different if I use __itt_pause() and __itt_resume() in my code to measure performance only of certain code sections.
I wonder if I need to configure gui or is something missing in project properties of the gui project which is causing this issue?
Also,
I am trying to do a line by line analysis of cache miss(LLC miss) for my software. However, I am not able to see these values in the vtune gui at the line by line level(all the back-end bound values, LLC miss, LLC Hit, DTLB overhead etc, are always 0, even if the back end bound operations are non zero). I wonder if it is possible to see LLC miss at a line by line level in vtune? (if yes,am I possibly missing something?)
Link Copied
- Mark as New
- Bookmark
- Subscribe
- Mute
- Subscribe to RSS Feed
- Permalink
- Report Inappropriate Content
Did you mean - ?
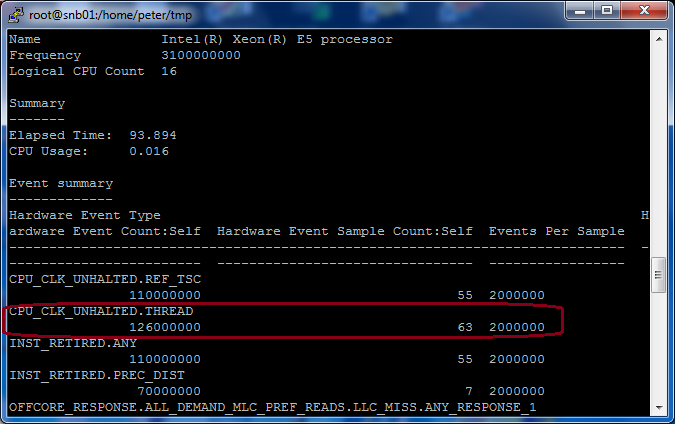
1. amplxe-cl -report summary -r r00?ah, at remote machine
2. amplxe-gui to open result copied from remote machine, but CPU_CLK_UNHALTED.THREAD event count in summary report is different from 1) ??
Incredible! Can you please post your zipped result directory on this thread?
- Mark as New
- Bookmark
- Subscribe
- Mute
- Subscribe to RSS Feed
- Permalink
- Report Inappropriate Content
- Mark as New
- Bookmark
- Subscribe
- Mute
- Subscribe to RSS Feed
- Permalink
- Report Inappropriate Content
Thanks for result directory. I got same result by using VTune GUI and command line. (VTune Amplifier XE 2013 Update 13)
Also, you can use below to display your source in command line, annotated with performance data
amplxe-cl -report hw-events -source-object function=func -r r008ge/
More detail, see my blog


Note: current Update 13 uses summary report to give out "metrics" info for GE collection, you can multiple-select hot functions in bottom-up report.
- Mark as New
- Bookmark
- Subscribe
- Mute
- Subscribe to RSS Feed
- Permalink
- Report Inappropriate Content
Okay. So, the thing is that if I create a project(add a src and build directory to it to do a line by line analysis) and then do an import results. I get wront values of the hardware event counts.
However, If I just open results instead of importing results in a project, then my counts are correct(as shown above). The problem is how do I load the source and symbol information in such case? as I do not have a way to define the path for source and binary. (it was defined in project properties in previous use case) ?
- Mark as New
- Bookmark
- Subscribe
- Mute
- Subscribe to RSS Feed
- Permalink
- Report Inappropriate Content
okay, I was able to give the symbols directory from command line.
Thanks!!!
- Mark as New
- Bookmark
- Subscribe
- Mute
- Subscribe to RSS Feed
- Permalink
- Report Inappropriate Content
I have more questions:
a) My Application reads packets from network and then process these packets. I am trying to do the performance analysis for the packet processing code path. In order to do this analysis, I use __itt_resume() and __itt_pause() to analyse on the code path where the packet is being processed. However this cause frequent calls to __itt_resume() and __itt_pase(). Is this a good idea or should this be avoided? I wonder if there are alternates to measure performance of this code path only? (leaving the rest of the processing? )
- Also, I have multiple processes running for which I want to do a combined performance analysis. I wonder if there is a way to do that? If I try to run multiple instances of amplxe-cl on pid for each of these processes. I usually get an error stating "PMU already in use"
- Mark as New
- Bookmark
- Subscribe
- Mute
- Subscribe to RSS Feed
- Permalink
- Report Inappropriate Content
Answering the last question it is so because VTune driver is accessing the PMU.
- Mark as New
- Bookmark
- Subscribe
- Mute
- Subscribe to RSS Feed
- Permalink
- Report Inappropriate Content
It is usually better to use __itt_task_begin / __itt_task_end for such purposes. In GUI select "Task Type / Function / Call Stack" grouping - you'll be able to analyze performance data aggregated to every task type.
When tasks are global you can try __itt_frame_begin_v3 / __itt_frame_end_v3. See more details here.
- Mark as New
- Bookmark
- Subscribe
- Mute
- Subscribe to RSS Feed
- Permalink
- Report Inappropriate Content
yup, but is there a way to analyze multiple process interacting with each other?
- Mark as New
- Bookmark
- Subscribe
- Mute
- Subscribe to RSS Feed
- Permalink
- Report Inappropriate Content
Probably not by spawning multiple instances of profiler each new instance will check for loaded driver and issue an error about the PMU being in use.
- Mark as New
- Bookmark
- Subscribe
- Mute
- Subscribe to RSS Feed
- Permalink
- Report Inappropriate Content
> The problem is how do I load the source and symbol information in such case?
You can use "amplxe-cl -finalize -search-dir all:rp=your_sym_dir -r r008ge" to resolve symbol info.
> yup, but is there a way to analyze multiple process interacting with each other?
VTune can do system wide profiling if you don't specify target process. All active processes will be monitored, you can get performance data of them, but there is no call stack info (only you specify target process, performance data will include call stack info of this process).
- Mark as New
- Bookmark
- Subscribe
- Mute
- Subscribe to RSS Feed
- Permalink
- Report Inappropriate Content
More question,
is it possible to modify event per sample value for the snb-general-exploration profile? (I think it is possible with -collect-with runsa option). I am interested in doing a line by line analysis of my code with lesser number of samples for an event.
- Mark as New
- Bookmark
- Subscribe
- Mute
- Subscribe to RSS Feed
- Permalink
- Report Inappropriate Content
> is it possible to modify event per sample value for the snb-general-exploration profile?
You can Copy from existing GE analysis, then modify it - change SAV value to get more samples. However all metrics defined in snb-general-exploration analysis will not displayed (that is why we call "GE collection" predefined analysis types), but all event counts still are displayed in report. I think that you don't care of this, you need to know more samples in source line.
Another approach is to use " -collect-with runsa " to add events from GE analysis, also there is no metric indicators.
- Subscribe to RSS Feed
- Mark Topic as New
- Mark Topic as Read
- Float this Topic for Current User
- Bookmark
- Subscribe
- Printer Friendly Page