- Mark as New
- Bookmark
- Subscribe
- Mute
- Subscribe to RSS Feed
- Permalink
- Report Inappropriate Content
We are looking for OpenCL timelines showing Haswell GPU command queues.
In more detail....We are transcoding some Cuda across to OpenCL under Windows, mostly targeting Haswell’s GPU. The Nvidia profilers gave us timelines containing kernels and data transfers, but we’re struggling to find something comparable with Intel tools. Code-Builder (as a VS plugin) has some simple application analysis tools, but nothing like proper timelines. We have tried Amplifier XE (GPU/CPU concurrency), but once again can’t find a way to see the relationship between the various command queues. Do we have to pay extra for the “Platform Analyser” tool before this is possible?
Second (related) question: we originally installed “intel SDK for OCL applications” to get Code Builder under visual studio. If I understand the marketing right, this has now gone away, with Code Builder now bundled inside “Intel Integrated Native Developer Experience (Intel® INDE)”. The free version of this gets the basic Code Builder, whilst the $800 version also gives me “Platform Analyzer”. True?
Link Copied
- Mark as New
- Bookmark
- Subscribe
- Mute
- Subscribe to RSS Feed
- Permalink
- Report Inappropriate Content
Answer your first question:
After you installing the VTune(TM) Amplifier XE, open a cmd as administrator then run "amplxe-vars.bat" to set VTune's environment, so you can use VTune's command line.
See my example:
amplxe-cl -collect advanced-hotspots -knob collection-detail=stack-sampling -knob enable-gpu-usage=true -knob enable-gpu-runtimes=true -knob gpu-counters-mode=global-local-accesses -duration 60 -- MonteCarlo.exe
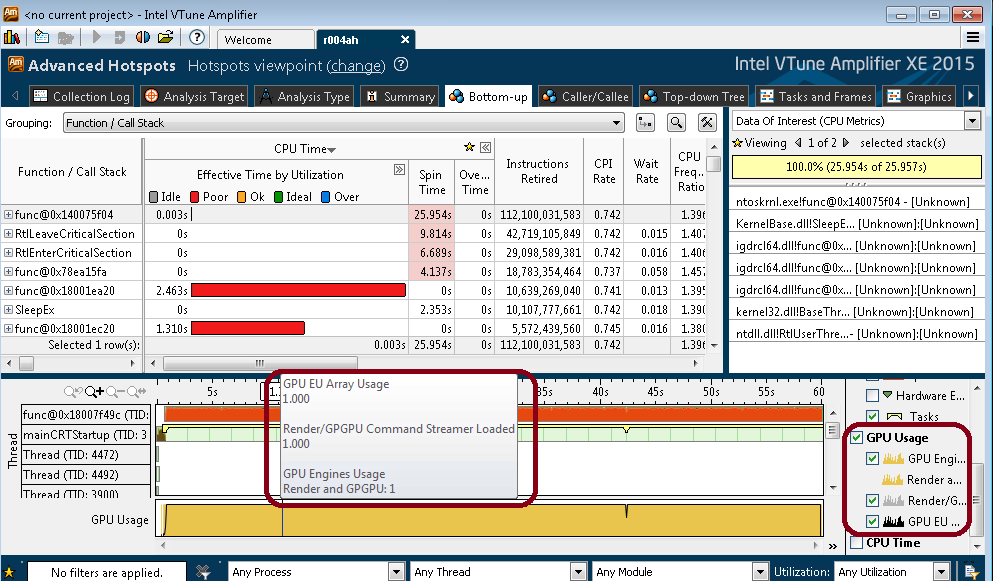
Thus, you can use amplxe-gui to open result to review Hottest GPU coomputing tasks in Summary report & (any time) GPU EU Array usage in timeline report.


- Mark as New
- Bookmark
- Subscribe
- Mute
- Subscribe to RSS Feed
- Permalink
- Report Inappropriate Content
- Mark as New
- Bookmark
- Subscribe
- Mute
- Subscribe to RSS Feed
- Permalink
- Report Inappropriate Content
Regarding the original question, here is an excellent article written by one of the developers on profiling OpenCL* code on Intel® HD Graphics.
- Mark as New
- Bookmark
- Subscribe
- Mute
- Subscribe to RSS Feed
- Permalink
- Report Inappropriate Content
Hi Volker,
1. Intel(R) OpenCL(T) Code Builder, part of Intel(R) INDE suite has an entry-level source level profiling (just highlights high-latency operations in your code - meaning read/write lines that take most time). you can download Intel(R) INDE here https://software.intel.com/en-us/intel-inde and then follow this article https://software.intel.com/en-us/articles/getting-started-with-opencl-development-on-windows-with-intel-inde if you just want the Code Builder portion.
2. Platform Analyzer and VTune Amplifier use the same underlying technology for the GPU analysis, though what is provided in Vtune is more sophisticated. VTune would be a safer bet.
- Subscribe to RSS Feed
- Mark Topic as New
- Mark Topic as Read
- Float this Topic for Current User
- Bookmark
- Subscribe
- Printer Friendly Page