- Mark as New
- Bookmark
- Subscribe
- Mute
- Subscribe to RSS Feed
- Permalink
- Report Inappropriate Content
Hello,
I'm trying to analyze simple serial aplication (matrix multipication) dedicated for Intel Xeon Phi coprocessor using VTune. I created native aplication, using -mmic flag and next copy it to mic0 using scp command. Next I ran analysis as shown in the link below :
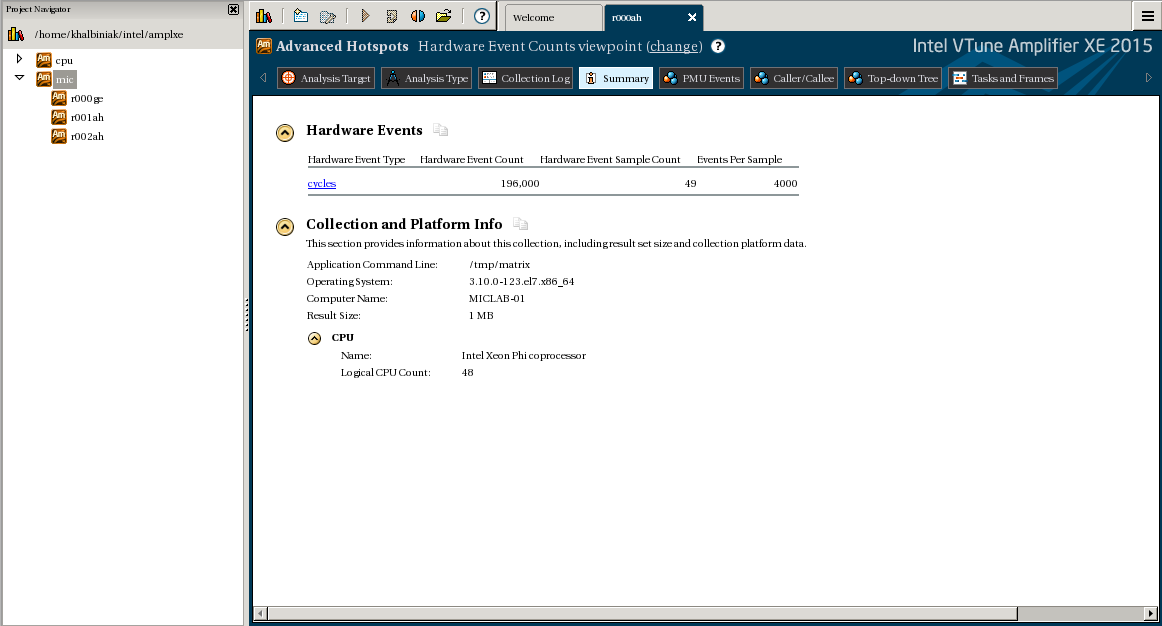
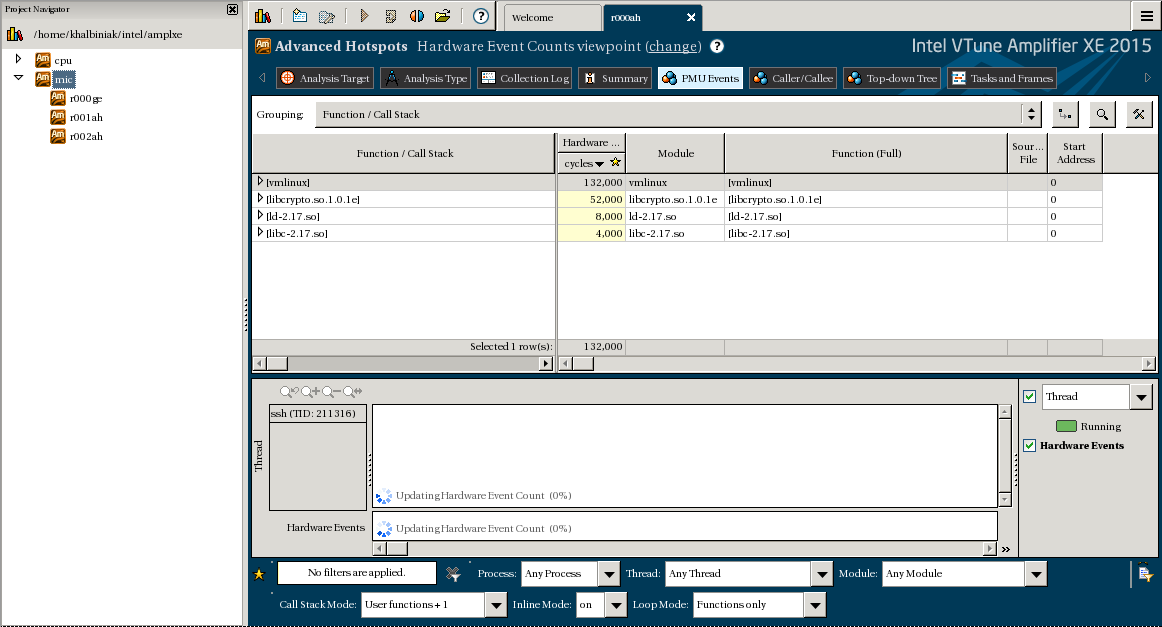
Upon completion I got the following result (pic.: vtune1, vtune2). In analisys result i did not get information as shown in the link above. I obtained the same result for General Exploration. Nothing information about implemented function etc.
Could You give me some suggestion what could be wrong?
Link Copied
- Mark as New
- Bookmark
- Subscribe
- Mute
- Subscribe to RSS Feed
- Permalink
- Report Inappropriate Content
Are you using VTune(TM) Amplifier XE 2015 Update 2?
Can you run matrix application without VTune? For example, "ssh mic0 /root/matrix.MIC"
It seemed that you application only collected data for "ssh" process, I don't know what you did on GUI. You may redo this via command line. Here is an example for your reference:
# amplxe-cl -collect advanced-hotspots --target-system=mic-native:0 --search-dir=. -- /root/matrix.MIC
Simply you can use "amplxe-cl -R hotspots" to verify the result, or use ample-gui to open result. vmlinux should NOT be the hottest function, which should be a function in matrix.
- Mark as New
- Bookmark
- Subscribe
- Mute
- Subscribe to RSS Feed
- Permalink
- Report Inappropriate Content
No I'm not using VTune Amplifier XE 2015 Update 2.
Yes, I can run my application without VTune. I tried to do it via command line but i got the same result.
I am doing following steps when I am running an analysis:
1. Copy exetubale file to mic: scp mic0:/tmp/
2. Run amplaxe-gui
3. Choose target system: Intel Xeon Phi (native)
4. Choose card number: 0(mic0)
5. Fill field Application: /tmp/matrix.mic
6. Click OK, next choose Advanced Hotsposts Analyze and start it.
- Mark as New
- Bookmark
- Subscribe
- Mute
- Subscribe to RSS Feed
- Permalink
- Report Inappropriate Content
You appear to be ignoring the instruction to launch your application on mic from the host side, e.g. by ssh mic0.
I guess you may be setting VTune to collect host data only. If you are using a good older version such as amplifier xe 2013 update 17, your only choices to collect with gui on mic side are the knc specific selections.
- Mark as New
- Bookmark
- Subscribe
- Mute
- Subscribe to RSS Feed
- Permalink
- Report Inappropriate Content
> Yes, I can run my application without VTune. I tried to do it via command line but i got the same result.
What was command line you used, and what were outputs?
You can verify if VTune can work on Xeon Phi, by using:
# ssh mic0 lsmod | grep sep ; vtune driver is loaded
sep3_15 45337 0
# amplxe-cl -c advanced-hotspots -target-system=mic-native:0 -d 5 ; data collection works, without target application.
Can you please try 2015 U2? Can you please post your result directory?
- Mark as New
- Bookmark
- Subscribe
- Mute
- Subscribe to RSS Feed
- Permalink
- Report Inappropriate Content
Hello,
Could you please check that elapsed time that VTune reports is the same as you have for the run without VTune?
It seems that the run was pretty short - probably the app was not run correctly under VTune on the card.
Thanks & Regards, Dmitry
- Mark as New
- Bookmark
- Subscribe
- Mute
- Subscribe to RSS Feed
- Permalink
- Report Inappropriate Content
> What was command line you used, and what were outputs?
amplxe-cl -collect advanced-hotspots --target-system=mic-native:0 --search-dir=. -- /tmp/matrix.mic
> You can verify if VTune can work on Xeon Phi...
VTune work on card.
# ssh mic0 lsmod | grep sep
sep3_15 45209 0
> Can you please try 2015 U2? Can you please post your result directory?
I will update VTune, then I will try again.
> Could you please check that elapsed time that VTune reports is the same as you have for the run without VTune?
Eplased time is smaller (equal 0).
I posted my result. Aplication was analyzed via command line. It is launched during analysis. I posted my application too. Source file and Makefile are located in matrix folder.
- Mark as New
- Bookmark
- Subscribe
- Mute
- Subscribe to RSS Feed
- Permalink
- Report Inappropriate Content
I cannot reproduce your problem with your test case:-(
# amplxe-cl -c advanced-hotspots -target-system=mic-native:0 -search-dir=. -- /root/matrix.out
# amplxe-cl -R hotspots
amplxe: Using result path `/home/peter/tmp/matrix/r000ah'
amplxe: Executing actions 50 % Generating a report
Function Module CPU Time Spin Time Overhead Time
-------------------------------- ----------------------- -------- --------- -------------
[vmlinux] vmlinux 16.637s 0s 0s
Multipication matrix.out 15.377s 0s 0s
[sep3_15] sep3_15 0.223s 0s 0s
memset libc-2.14.90.so 0.142s 0s 0s
In your result, It seemed matrix.out ran shortly and no sample for Multipication captured, only [vmlinux] had samples.
> Eplased time is smaller (equal 0).
On my side, matrix.out ran ~13s without VTune, and run ~15s with VTune. Please check.
By the way, you need to copy all contents under "/opt/intel/composer_xe_2015/lib/mic/" (for example) to mic0:/lib64 first, then app on MIC can run properly.
- Mark as New
- Bookmark
- Subscribe
- Mute
- Subscribe to RSS Feed
- Permalink
- Report Inappropriate Content
Ok, I copied this components and changed matrixes size.
Now matrix.out ran ~ 37s without VTune and ~32s with VTune. But result are the same. Multipication function is not one the list. VTune still does not show corretly information about logical CPU count (48 instead 244). I am waiting for VTune Update 2. After update i will analyze it again.
- Mark as New
- Bookmark
- Subscribe
- Mute
- Subscribe to RSS Feed
- Permalink
- Report Inappropriate Content
> Now matrix.out ran ~ 37s without VTune and ~32s with VTune...
This is an expected result. Please try VTune Amplifier XE 2015 U2, if the problem persists on, attach your result directory again. Thank you.
- Mark as New
- Bookmark
- Subscribe
- Mute
- Subscribe to RSS Feed
- Permalink
- Report Inappropriate Content
Hello,
I updated my VTune to Update 2 and now it's OK. Thanks for help :)
- Mark as New
- Bookmark
- Subscribe
- Mute
- Subscribe to RSS Feed
- Permalink
- Report Inappropriate Content
Good to hear, thank you!
Regards, Dmitry
- Mark as New
- Bookmark
- Subscribe
- Mute
- Subscribe to RSS Feed
- Permalink
- Report Inappropriate Content
Hello,
I have another question but i don't want create new topic. My VTune analyze Xeon Phi application correctly. But I would like to ask You about display the result.
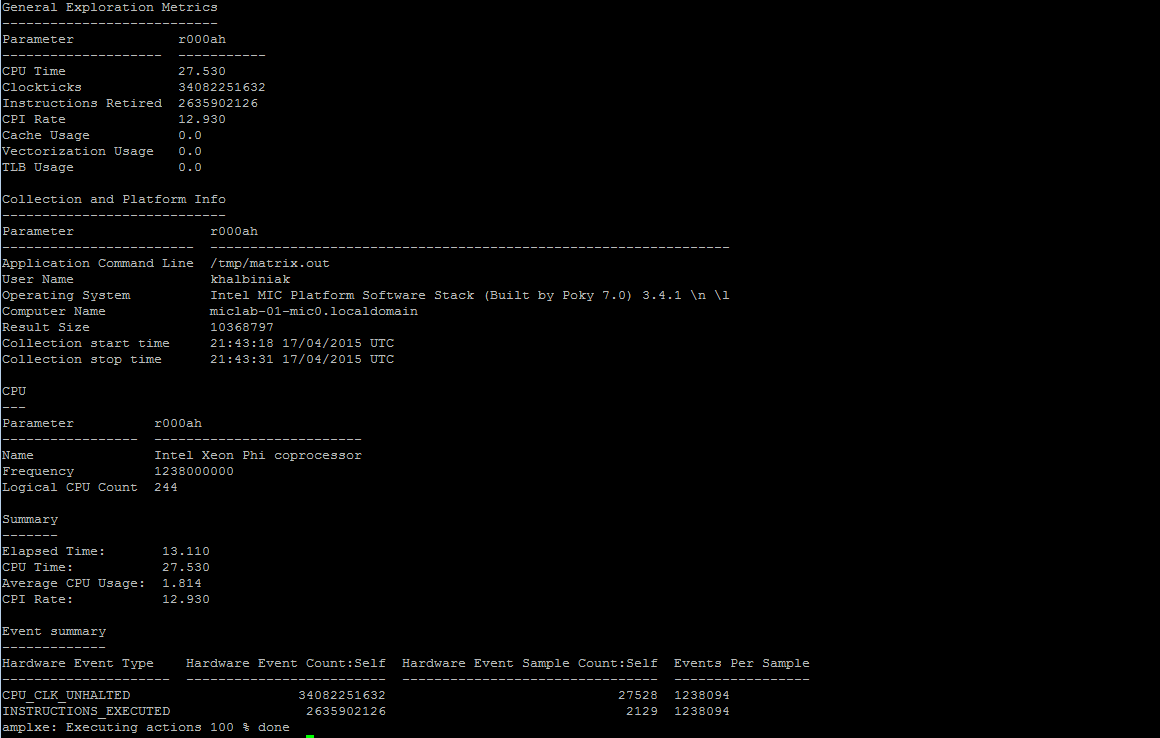
I use command line to run analyze program on coprocessor. When I display result via command line I have more information about my application than when I do it via GUI eg (CPI Rate). Why my result does not display information about CPU utilization like in hotspots analyze in CPU?
- Mark as New
- Bookmark
- Subscribe
- Mute
- Subscribe to RSS Feed
- Permalink
- Report Inappropriate Content
Hi Kamil:
See the "viewpoints" menu at the top of the display. Currently, you are viewing "Hardware Event Counts". Try "Hotspots".

- Subscribe to RSS Feed
- Mark Topic as New
- Mark Topic as Read
- Float this Topic for Current User
- Bookmark
- Subscribe
- Printer Friendly Page