- Mark as New
- Bookmark
- Subscribe
- Mute
- Subscribe to RSS Feed
- Permalink
- Report Inappropriate Content
Link Copied
- Mark as New
- Bookmark
- Subscribe
- Mute
- Subscribe to RSS Feed
- Permalink
- Report Inappropriate Content
Hi Pavitra,
Thanks for reaching out to us.
We suggest you to try system-wide profiling option available in Intel Vtune Profiler. For that, please follow the below steps:
1. Use the Microarchitecture Exploration analysis (formerly known as General Exploration) available in Vtune to collect the cache misses for your application. While configuring your application, select analysis target for your project as Profile System on WHAT pane and analysis type as Microarchitecture Exploration on HOW pane.[Please refer to 1_Profile_system.JPG]. This will analyze the whole system in which your application is running.
2. Once the report got generated, click on Bottom-up window to view the detailed metrics. You can filter your application from this window as shown in the attached screenshot 2_Select_process.JPG by selecting particular process.
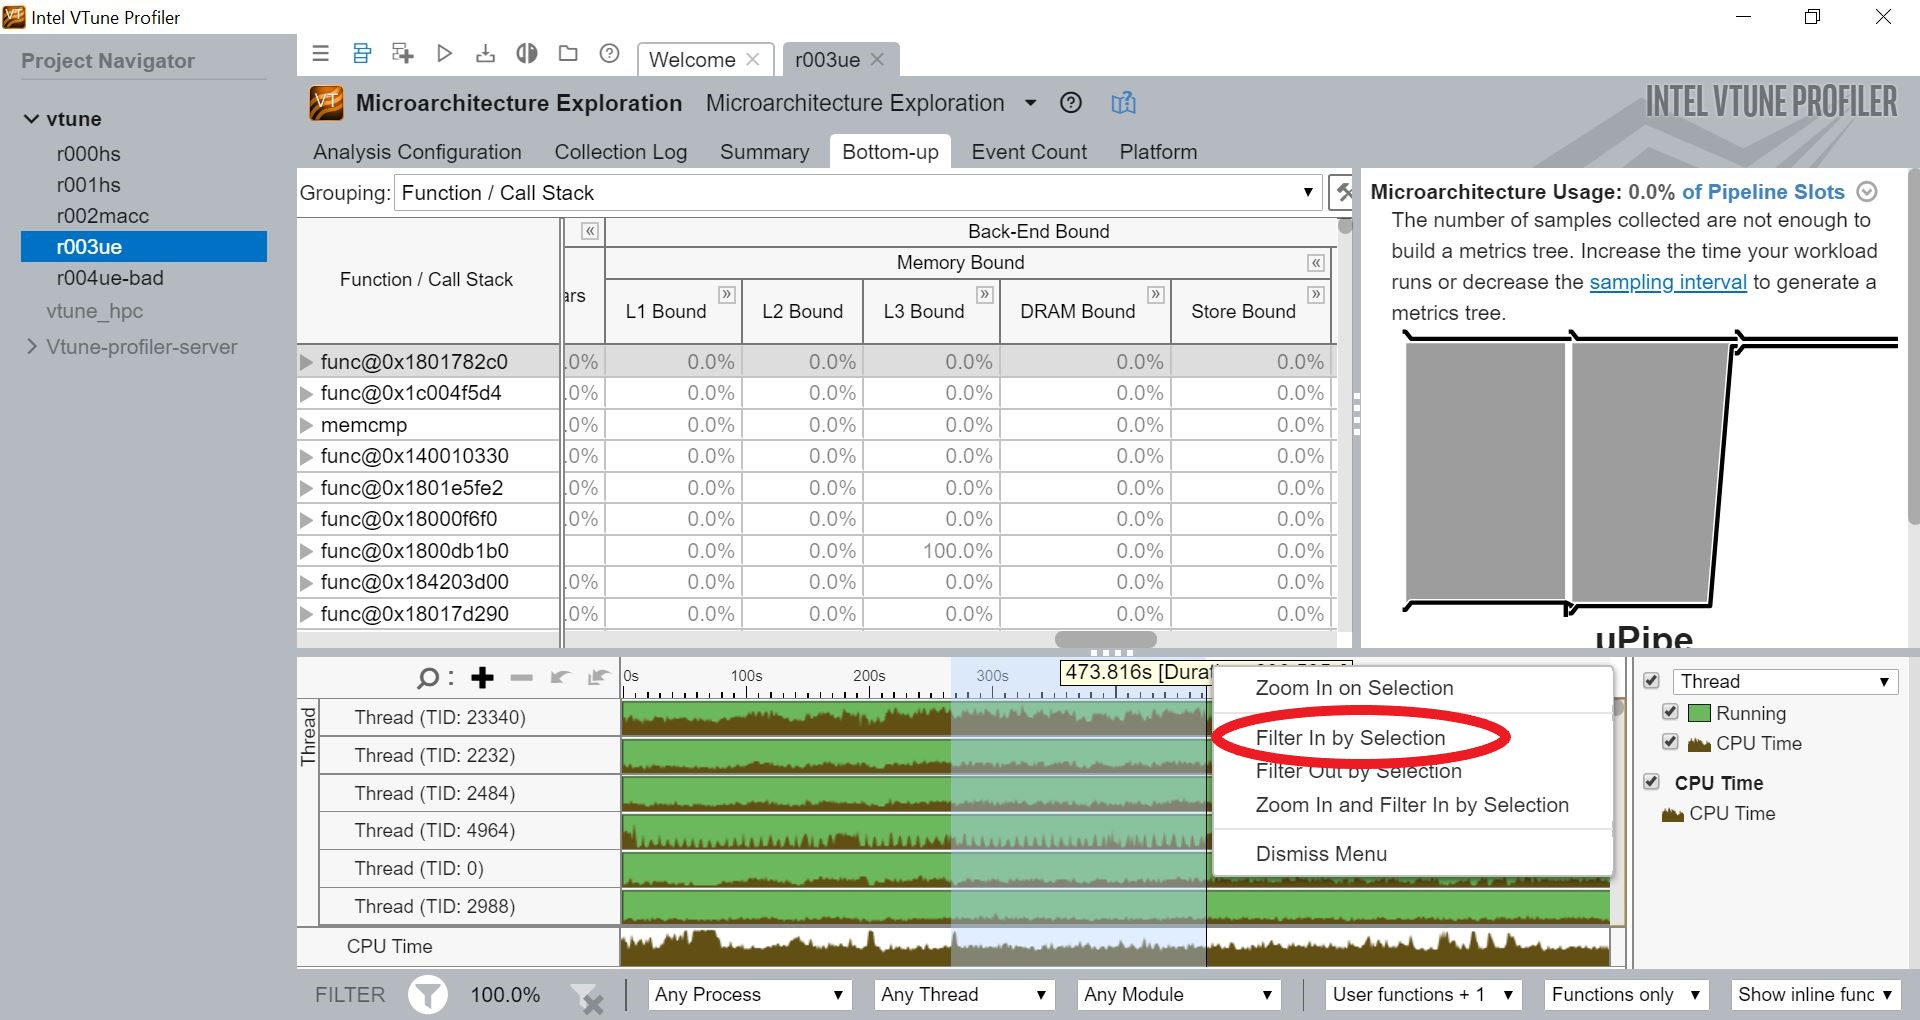
3. Then, you can filter it based on time if you want to get the metrics for a particular time by dragging in timeline pane and clicking on "Filter In by Selection". This will display metrics for the particular time selected.[Refer to 3_filter_by_time.JPG]
Regards,
Chithra
- Mark as New
- Bookmark
- Subscribe
- Mute
- Subscribe to RSS Feed
- Permalink
- Report Inappropriate Content
Hi Pavitra,
Could you please give us an update on this?
Regards,
Chithra
- Mark as New
- Bookmark
- Subscribe
- Mute
- Subscribe to RSS Feed
- Permalink
- Report Inappropriate Content
Hi Pavitra,
Please let me know if your query is resolved or not. If not, we also suggest you to use ITT(Instrumentation and Tracing Technology) API provided by Intel Vtune Profiler. This library helps you to select a particular portion of your application and allows you to profile/analyze that section only.
To use the APIs, add API calls in your code to designate logical tasks. This will help you visualize the relationship between tasks in your code, including when they start and end, relative to other CPU and GPU tasks.
At the highest level a task is a logical group of work executing on a specific thread, and may correspond to any grouping of code within your program that you consider important. You can mark up your code by identifying the beginning and end of each logical task with
__itt_task_begin
and
__itt_task_end
calls.
Regards,
Chithra
- Mark as New
- Bookmark
- Subscribe
- Mute
- Subscribe to RSS Feed
- Permalink
- Report Inappropriate Content
Thanks a lot maam for your prompt response.
I am working on this. But what i actually wanted to achieve is, while performing execution of an application, i want to get notified when the cache missses of that particular application exceed a particular value. In other words, i need to fetch the count of cache misses in real time , into another program, so that i could compare the count with a predetermined threshold. How can this be achieved in run time? Please help me with this.
- Mark as New
- Bookmark
- Subscribe
- Mute
- Subscribe to RSS Feed
- Permalink
- Report Inappropriate Content
Hi Pavitra,
Intel Vtune Profiler doesn't have an option to get information(like cache misses) in real time. That is, in Vtune, the data is collected processed and visualized only after profiling the application. So, sorry for the inconvenience caused. If possible, could you please elaborate more on your use case such as what kind of application you are trying to analyze.
Regards,
Chithra
- Mark as New
- Bookmark
- Subscribe
- Mute
- Subscribe to RSS Feed
- Permalink
- Report Inappropriate Content
Hi Pavitra,
We haven't heard back anything from you. We would discontinue monitoring this tread. Please feel free to raise a new thread for further queries/issues.
Regards,
Chithra
- Subscribe to RSS Feed
- Mark Topic as New
- Mark Topic as Read
- Float this Topic for Current User
- Bookmark
- Subscribe
- Printer Friendly Page