- Mark as New
- Bookmark
- Subscribe
- Mute
- Subscribe to RSS Feed
- Permalink
- Report Inappropriate Content
Hi I was trying gpu profiling on devcloud and I am getting incomplete profiler results.
I stumbled across https://www.intel.com/content/www/us/en/develop/documentation/vtune-help/top/installation/set-up-system-for-gpu-analysis.html .
Can you add me to the "video" group so I can do gpu profiling using vtune on devcloud?
Link Copied
- Mark as New
- Bookmark
- Subscribe
- Mute
- Subscribe to RSS Feed
- Permalink
- Report Inappropriate Content
Hi,
Thank you for posting in Intel Communities.
As you are trying on Devcloud There is no separate video group available in Devcloud. I ran GPU offload analysis on Devcloud and it works fine. Let me share the steps I followed for vector-add sample.
Connect to the Devcloud:
ssh devcloud
Currently you are in login node then connect to compute node :
qsub -I -l nodes=1:gpu:ppn=2 -d .
or
qsub -I -l nodes=1:dual_gpu:ppn=2 -d .
Download the samples.
git clone https://github.com/oneapi-src/oneAPI-samples.git
Go to the vector-add sample
cd oneAPI-samples/DirectProgramming/DPC++/DenseLinearAlgebra/vector-add/src
In this directory you can find 2 samples with following names: vector-add-buffers.cpp, vector-add-usm.cpp you can select any one of them.
Now we need to build an executable file:
dpcpp ./vector-add-buffers.cpp -o vector-add-buffer
Now an executable is created with name vector-add-buffer, with help of this we can profile on Vtune.
GPU offload analysis:
vtune -collect gpu-offload ./vector-add-buffer
You can find a logs in same directory (eg:r000go)
In Devcloud wouldn't be possible to add a specific user to any group as the permissions would remain the same for all users.
Thanks,
Jaideep
- Mark as New
- Bookmark
- Subscribe
- Mute
- Subscribe to RSS Feed
- Permalink
- Report Inappropriate Content
Hi Jaideep, I am trying to run https://www.intel.com/content/www/us/en/develop/documentation/vtune-help/top/analyze-performance/accelerators-group/gpu-compute-media-hotspots-analysis.html#gpu-compute-media-hotspots-analysis_CODE-LEVEL
I got below command line from vtune:
vtune -collect-with runsa -knob enable-stack-collection=true -knob useEventBasedCounts=true -knob "gpu-profiling-mode=0:0:2.0|instcount" -knob "gpu-counters-mode=0:0:2.0|global-local-accesses" -knob enable-gpu-usage=true -knob collectMemObjects=true -knob analyzeDgfxBandwidth=true -knob collectPStateData=falsevtune -collect-with runsa -knob enable-stack-collection=true -knob useEventBasedCounts=true -knob "gpu-profiling-mode=0:0:2.0|instcount" -knob "gpu-counters-mode=0:0:2.0|global-local-accesses" -knob enable-gpu-usage=true -knob collectMemObjects=true -knob analyzeDgfxBandwidth=true -knob collectPStateData=false ./gemm-run-gpu.out
I get error:
vtune: Error: Events for detailed GPU utilization analysis cannot be collected due to a lack of credentials. Make sure you have read/write access to debugFS. You may either run the analysis with root privileges (recommended) or follow the configuration instructions provided in the Linux and Android Kernel Analysis help to
pic.
Maybe it's not possible to do this analysis on devcloud?
- Mark as New
- Bookmark
- Subscribe
- Mute
- Subscribe to RSS Feed
- Permalink
- Report Inappropriate Content
Hello Vaidya,
Given message should be considered as "Info", not as "Error". The point is that option enable-gpu-usage requires access to debugFS.
So, VTune work as designed, however I agree that message should improved.
Is it possible to disable this option?
Maybe I can help to configure analysis for collecting data whish is needed to you?
Best regards,
Sergey
- Mark as New
- Bookmark
- Subscribe
- Mute
- Subscribe to RSS Feed
- Permalink
- Report Inappropriate Content
Hello Sergey,
Maybe I can help to configure analysis for collecting data whish is needed to you?
That would be awesome. I am trying to get the values of gpu metrics: https://www.intel.com/content/www/us/en/develop/documentation/vtune-help/top/reference/gpu-metrics-reference.html using vtune when I run my kernel (as I change the design of kernel). In particular I am trying to look at:
1. Local memory accesses (or utilized bandwidth) to verify if the kernel is spilling or not
2. Shared memory accesses and bank conflicts (https://www.intel.com/content/www/us/en/develop/documentation/iocl-opg/top/optimizing-opencl-usage-with-intel-processor-graphics/memory-access-considerations/recommendations/local-memory.html)
3. Dram accesses (or utilized bandwidth)
----
Is it possible to disable this option?
I am not sure which option you are referring here.
----
Thanking you,
+miheer
- Mark as New
- Bookmark
- Subscribe
- Mute
- Subscribe to RSS Feed
- Permalink
- Report Inappropriate Content
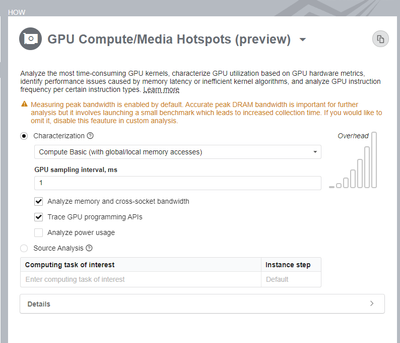
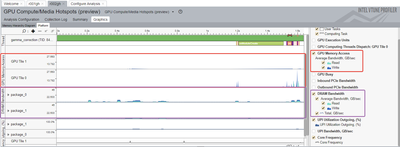
For getting GPU Memory and DRAM memory bandwidth, you could run predefined GPU Hotspot analysis:
vtune -collect gpu-hotspots -knob collect-memory-bandwidth=true
The same in GUI:
Result:
But unfortunately, only few hosts could measure SLM traffic.
Could you specify CPU and GPU on your system?
By the way, you could use vtune-backend server for remote access with UI
___________
Is it possible to disable this option?
I am not sure which option you are referring here.
I mean this option:
vtune -collect-with runsa -knob enable-stack-collection=true -knob useEventBasedCounts=true -knob "gpu-profiling-mode=0:0:2.0|instcount" -knob "gpu-counters-mode=0:0:2.0|global-local-accesses" -knob enable-gpu-usage=true -knob collectMemObjects=true -knob analyzeDgfxBandwidth=true -knob collectPStateData=falsevtune -collect-with runsa -knob enable-stack-collection=true -knob useEventBasedCounts=true -knob "gpu-profiling-mode=0:0:2.0|instcount" -knob "gpu-counters-mode=0:0:2.0|global-local-accesses" -knob enable-gpu-usage=true -knob collectMemObjects=true -knob analyzeDgfxBandwidth=true -knob collectPStateData=false ./gemm-run-gpu.out
Best regards,
Sergey
- Mark as New
- Bookmark
- Subscribe
- Mute
- Subscribe to RSS Feed
- Permalink
- Report Inappropriate Content
Hello Sergey,
I am on using Intel(R) Xeon(R) E-2176G looking at gen9 gpus on (s001-n157).
- Mark as New
- Bookmark
- Subscribe
- Mute
- Subscribe to RSS Feed
- Permalink
- Report Inappropriate Content
Hello Sergey,
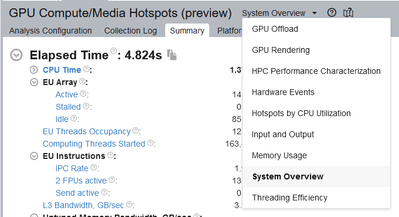
I don't see the tab "GPU Compute/Media Hotspots (preview)" in the available options as shown in your screenshot (and I guess because of that I don't see the graph which you have posted in earlier reply). Which vtune version are you using?
Intel(R) oneAPI VTune(TM) Profiler 2022.0.0 (build 621730) Command Line Tool (/glob/development-tools/versions/oneapi/2022.1.1/oneapi/vtune/2022.0.0/bin64/vtune).
- Mark as New
- Bookmark
- Subscribe
- Mute
- Subscribe to RSS Feed
- Permalink
- Report Inappropriate Content
Hello!
You use correct version of VTune. GPU Hotspots viewpoint could be hidden in a case, when some of important data were not collected. It could be result of incorrect system configuration, or bug on VTune side.
Could you attach result for proper analysis and log of .../bin64/vtune-self-checker ?
Best regards,
Sergey
- Mark as New
- Bookmark
- Subscribe
- Mute
- Subscribe to RSS Feed
- Permalink
- Report Inappropriate Content
Hi,
Thank you for sharing the command. We were able to reproduce the same issue and informed to Development team as well. We are working on this and we will get back to you soon.
Thanks,
Jaideep
- Mark as New
- Bookmark
- Subscribe
- Mute
- Subscribe to RSS Feed
- Permalink
- Report Inappropriate Content
Hi,
We have not heard back from you. This thread will no longer be monitored by Intel. If you need further assistance, please post a new question.
Thanks,
Jaideep
- Subscribe to RSS Feed
- Mark Topic as New
- Mark Topic as Read
- Float this Topic for Current User
- Bookmark
- Subscribe
- Printer Friendly Page


