- Mark as New
- Bookmark
- Subscribe
- Mute
- Subscribe to RSS Feed
- Permalink
- Report Inappropriate Content
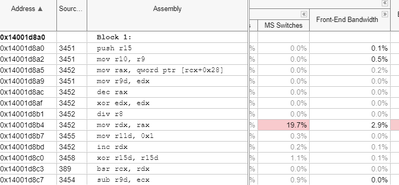
I am interested in understanding the MS Switches counter in the micro architecture exploration.
I saw this flagged as red in the summary and thought based on the description that I was using some instruction that couldn't be handled easily by the processor. Instead I see an div instruction.
Now I know divides are performance killers. I have a dual 16 core broadwell system with hyperthreading. I try to minimize divides. I just added this divide instead of a table lookup and I got faster code. I know that the resources to do divides are shared by hyperthreads and I have all of the threads working.
So is this just an indication that this shared resource is the bottleneck?
- Mark as New
- Bookmark
- Subscribe
- Mute
- Subscribe to RSS Feed
- Permalink
- Report Inappropriate Content
Your analysis looks correct.
Events sometimes have what is known as "skid" there is a measurable time interval from where an event occurs to when we can get the PC and record where it occurs. Often, in the case of instructions that do take longer time, you will need to examine the instruction flow to find the likely culprit.
Link Copied
- Mark as New
- Bookmark
- Subscribe
- Mute
- Subscribe to RSS Feed
- Permalink
- Report Inappropriate Content
Hi,
We are forwarding the case to SME.
- Mark as New
- Bookmark
- Subscribe
- Mute
- Subscribe to RSS Feed
- Permalink
- Report Inappropriate Content
We have a pretty good description in our reference manual: https://software.intel.com/content/www/us/en/develop/documentation/vtune-help/top/reference/cpu-metrics-reference/front-end-bound/ms-switches.html
MS Switches
Metric Description
This metric represents a fraction of cycles when the CPU was stalled due to switches of uop delivery to the Microcode Sequencer (MS). Commonly used instructions are optimized for delivery by the DSB or MITE pipelines. Certain operations cannot be handled natively by the execution pipeline, and must be performed by microcode (small programs injected into the execution stream). Switching to the MS too often can negatively impact performance. The MS is designated to deliver long uOp flows required by CISC instructions like CPUID, or uncommon conditions like Floating Point Assists when dealing with Denormals.
Possible Issues
A significant fraction of cycles was stalled due to switches of uOp delivery to the Microcode Sequencer (MS). Commonly used instructions are optimized for delivery by the DSB or MITE pipelines. Certain operations cannot be handled natively by the execution pipeline, and must be performed by microcode (small programs injected into the execution stream). Switching to the MS too often can negatively impact performance. The MS is designated to deliver long uOp flows required by CISC instructions like CPUID, or uncommon conditions like Floating Point Assists when dealing with Denormals. Note that this metric value may be highlighted due to Microcode Sequencer issue.
- Mark as New
- Bookmark
- Subscribe
- Mute
- Subscribe to RSS Feed
- Permalink
- Report Inappropriate Content
Hi,
Well I read the description inthe manual etc and I am looking for the reason it applies to the div instruction. I am assuming the div hear as the flagged instruction is the next one after the div.
- Mark as New
- Bookmark
- Subscribe
- Mute
- Subscribe to RSS Feed
- Permalink
- Report Inappropriate Content
Your analysis looks correct.
Events sometimes have what is known as "skid" there is a measurable time interval from where an event occurs to when we can get the PC and record where it occurs. Often, in the case of instructions that do take longer time, you will need to examine the instruction flow to find the likely culprit.
- Subscribe to RSS Feed
- Mark Topic as New
- Mark Topic as Read
- Float this Topic for Current User
- Bookmark
- Subscribe
- Printer Friendly Page
