- Mark as New
- Bookmark
- Subscribe
- Mute
- Subscribe to RSS Feed
- Permalink
- Report Inappropriate Content
Hello,
I am using vtune profiler 2022 on windows.
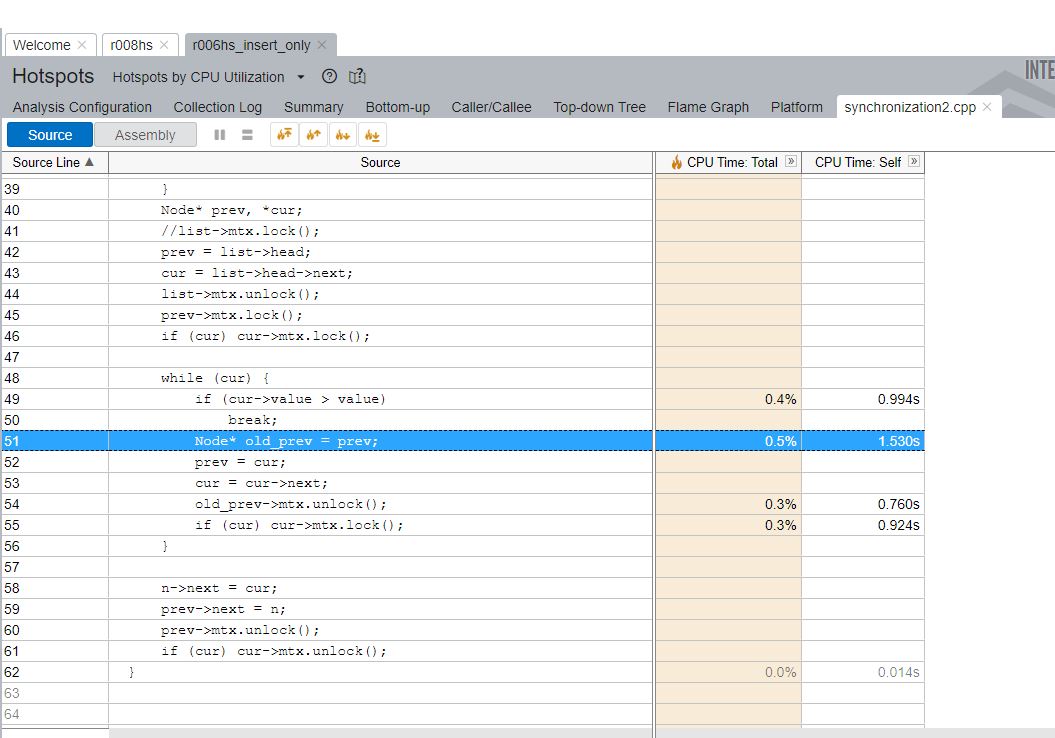
I am running a multithreaded app that runs over 50 seconds (long enough). I am attaching the source + time view of one of the main functions.
I don't understand the times per line that I get. Specifically,
1. why I get time for line 51 and nothing for line 52 (which is always executed after line 51) ?
2. lines 54-55 are function calls. What the CPU time: self for each of these lines mean ? is it the time these functions are executed or the total time of the overhead of the function calls themselves ?
3. why there is no report per each and every source line ?
Thanks in advance
Link Copied
- Mark as New
- Bookmark
- Subscribe
- Mute
- Subscribe to RSS Feed
- Permalink
- Report Inappropriate Content
Hi,
Thank you for posting in Intel Communities. Please find the answers for your questions below:
>>1. why I get time for line 51 and nothing for line 52 (which is always executed after line 51) ?
Though line 51 executes after line 52, the time taken for the CPU to process line 52 would be negligible(as it is assigning only). Usually, the CPU time, which is significant, would be visible and the ones in microseconds/milliseconds wouldn’t be visible. They would be counted as miscellaneous.
>>2. lines 54-55 are function calls. What the CPU time: self for each of these lines mean ? is it the time these functions are executed or the total time of the overhead of the function calls themselves ?
Self-time shows how much time was spent on a particular program unit. For example, Self-time for a source line shows the time the application spent at this source line.
Total time shows the total amount of time that the program unit incurs. For functions, Total time includes Self time of the function itself and Self time of all functions that were called from that function. Total time enables a high-level understanding of how time is spent in the application.
>>3. why there is no report per each and every source line ?
Usually, the CPU time, which is significant, would be visible and the ones in microseconds/milliseconds wouldn’t be visible. They would be counted as miscellaneous.
If this resolves your issue, make sure to accept this as a solution. This helps others with the similar issue.
Regards,
Alekhya
- Mark as New
- Bookmark
- Subscribe
- Mute
- Subscribe to RSS Feed
- Permalink
- Report Inappropriate Content
>>1. why I get time for line 51 and nothing for line 52 (which is always executed after line 51) ?
Though line 51 executes after line 52, the time taken for the CPU to process line 52 would be negligible(as it is assigning only). Usually, the CPU time, which is significant, would be visible and the ones in microseconds/milliseconds wouldn’t be visible. They would be counted as miscellaneous.
Sorry, I don't understand. line 52 always executed after line 51. Both are simply (assignment only). so they should take similar time. hence, why 51 has timing and 52 does not have timing ?
I am reattaching the screen capture again for convenience.
Thanks, Yariv
- Mark as New
- Bookmark
- Subscribe
- Mute
- Subscribe to RSS Feed
- Permalink
- Report Inappropriate Content
Hi,
Line 51 is quite different from line 52 and 53 as line 51 is not assignment only. In line 51, a new node pointer is initialized and then assignment is being done.
We have reproduced your issue with a minimal, reproducible sample code & could observe that initializing a node pointer & assigning that to another variable whenever the loop runs is consuming some of the CPU time. If we initialized it outside the loop, assignment wouldn’t take much/any CPU time. We have attached both of our code screenshots to show you the difference.
Initializing every time(inside the loop):

Initializing only once( outside the loop):

And in some scenarios, if there is no report for any source line, we can assume that the CPU metrics are too low/none.
If this resolves your issues/doubts, make sure to accept this as a solution. This might help others with similar issue. Thank you!
Regards,
Alekhya
- Mark as New
- Bookmark
- Subscribe
- Mute
- Subscribe to RSS Feed
- Permalink
- Report Inappropriate Content
Hi,
Is your issue resolved? Could you give us an update regarding this issue?
Regards,
Alekhya
- Mark as New
- Bookmark
- Subscribe
- Mute
- Subscribe to RSS Feed
- Permalink
- Report Inappropriate Content
Hi,
We assume that your issue is resolved. If you need any further assistance, please post a new thread as this thread will no longer be monitored by Intel.
Regards,
Alekhya
- Subscribe to RSS Feed
- Mark Topic as New
- Mark Topic as Read
- Float this Topic for Current User
- Bookmark
- Subscribe
- Printer Friendly Page