- Mark as New
- Bookmark
- Subscribe
- Mute
- Subscribe to RSS Feed
- Permalink
- Report Inappropriate Content
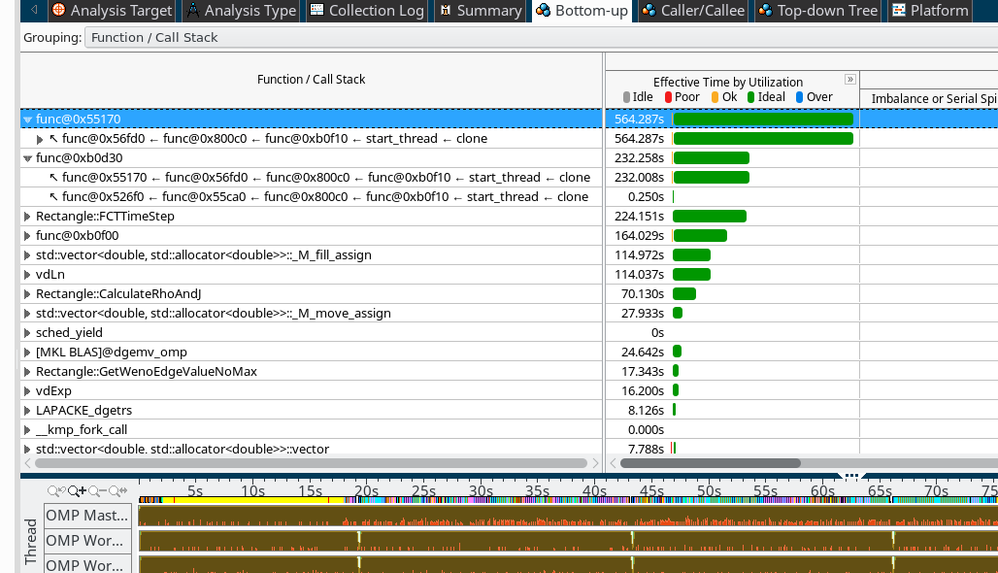
I'm not 100% sure of how I should be interpreting the results of my current vtune profiles. I'm getting basically no spin time, no waits or barriers holding me up, and everything is a nice across-the-board green in terms of utilisation.
However, if you take a look at the bottom-up view here, you'll notice that most of my time is sitting in libiomp5 running clone.
To me, this seems like most of my runtime is spent generating threads and not much else. Can I interpret this result as poor management of my openmp pragmas? Is it because I'm forking/joining too often? Or is this something that is expected since I have time utilisation green everywhere?
Link Copied
- Mark as New
- Bookmark
- Subscribe
- Mute
- Subscribe to RSS Feed
- Permalink
- Report Inappropriate Content
You are looking at a "bottom up" call stack view, so until you expand them, the time shown is for all functions called from the named function. It is thus unsurprising that "clone" shows up as the thing with most time, since it will always be the outermost level of the call-stack in every thread except the master!
Since this is an OpenMP code, I would start with VTune's OpenMP analysis, though from what you're saying, you may be doing OK here. If the OpenMP aspects are OK, then you probably want to investigate the serial performance and vectorization of the functions (and loops) that show the highest execution time. Advisor's roofline modelling may also be useful then to show you memory bandwidth issues.
- Mark as New
- Bookmark
- Subscribe
- Mute
- Subscribe to RSS Feed
- Permalink
- Report Inappropriate Content
From the screenshot it might be the case that by some chance VTune could not resolve functions from OpenMP runtime and hence the could not be classified as spin or overhead. Did you finalize the result on the same machine where it was collected? What is Intel Compiler version?
Until we figure this out - could you please switch to summary pane and observe OpenMP analysis section? It should show you several important metrics like serial time and potential gain based on instrumentation that will allow you partially judge on OpenMP parallelization efficiency.
Thanks & Regards, Dmitry
- Mark as New
- Bookmark
- Subscribe
- Mute
- Subscribe to RSS Feed
- Permalink
- Report Inappropriate Content
Thanks for the info guys,
It does seem as though the calls are not being classified correctly. If I set KMP_BLOCKTIME=0 these functions drop from view and the output is as I'd expect.
I'm using the current package as available on the Arch Linux AUR: 2017.17.0.1.1.132-4-x86_64 and a student license. And yes - the complier, vtune, everything is run from the same machine.
The openmp analysis section is indeed helpful. Seems like I'm doing quite well for the loops that I do have paralellised, however the workers do spin over a good portion of my code at the moment. So unless there's anything more specific I should try, I'm happy to interpret this is effectively spin time and work from there.
Good tip about the roofline modelling James, I haven't seen that at all yet.
- Subscribe to RSS Feed
- Mark Topic as New
- Mark Topic as Read
- Float this Topic for Current User
- Bookmark
- Subscribe
- Printer Friendly Page
