- Mark as New
- Bookmark
- Subscribe
- Mute
- Subscribe to RSS Feed
- Permalink
- Report Inappropriate Content
Dear Forum members,
I have encountered some unusual behaviour in VTune displaying the time spent in various subroutines inlined by IPO. I managed to reproduce my problem in a simple example using ifort version 16.0.1 and VTune Update 1 (build 434111):
test.f90
PROGRAM test
  USE m1
  IMPLICIT NONE

  INTEGER, PARAMETER ::no_repeats = 100
  INTEGER, PARAMETER :: n = 100000000
  INTEGER :: repeat, i
  REAL :: gamma, delta, epsilon
  REAL, DIMENSION(:), ALLOCATABLE :: a, b, c


  ALLOCATE( a(1:n) )
  ALLOCATE( b(1:n) )
  ALLOCATE( c(1:n) )

  a = 1.0
  b = 1.0
  c = 2.0

  DO repeat = 1, no_repeats
    DO i = 1, n

      epsilon = b(i)
      CALL sub1( i+1, epsilon, gamma )
      epsilon = c(i)
      CALL sub1( i+2, epsilon, delta )
      a(i) = a(i) + gamma * delta
    ENDDO  ! n
  ENDDO    ! repeat

END PROGRAM test
sub2.f90
MODULE m1
  IMPLICIT NONE
  CONTAINS

  SUBROUTINE sub1( k, alpha, beta )
    IMPLICIT NONE

    INTEGER, INTENT(IN) :: k
    REAL, INTENT(IN) :: alpha
    REAL, INTENT(OUT) :: beta


    IF( MOD( k, 10 ) == 0 ) THEN
      beta = 4.0 * alpha
    ELSE
      beta = 2.0 * alpha
    ENDIF

  END SUBROUTINE sub1

END MODULE m1
compile.sh
#!/bin/sh

ifort -c -no-vec -O3 -ipo -debug full sub1.f90
ifort -c -no-vec -O3 -ipo -debug full test.f90
ifort -no-vec -O3 -ipo -debug full sub1.o test.o -o test
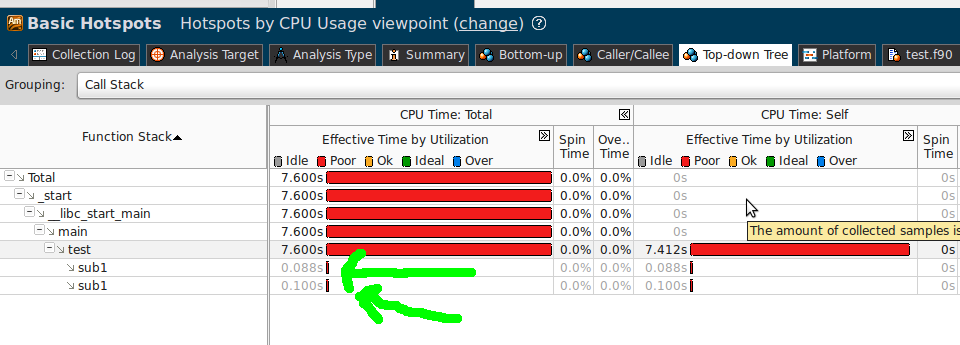
After running this program under VTune, the Top-down window shows plausible results, both instances of the inlined subroutine sub1 are assigned similar runtimes:
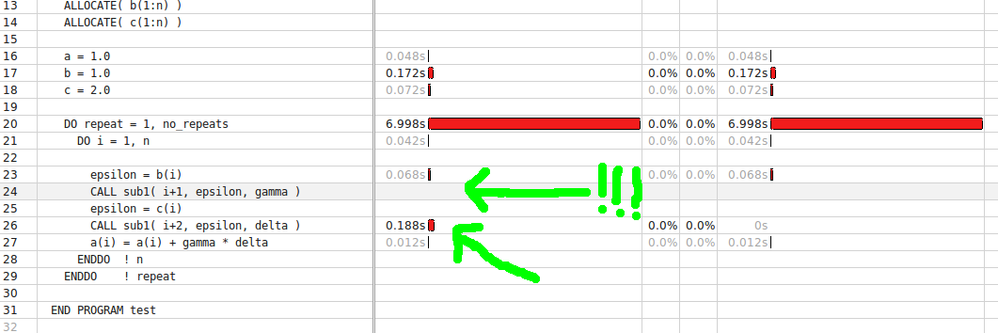
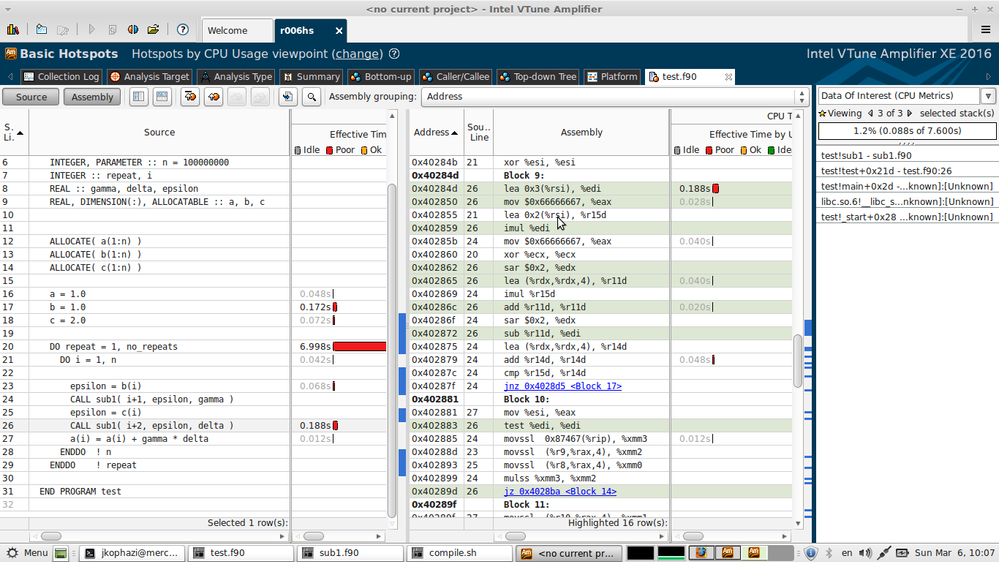
However, if I open the source code of "test" to check the time consumption of the various inlined instances of sub1, all time (0.188s) is assigned to the second inline instance:
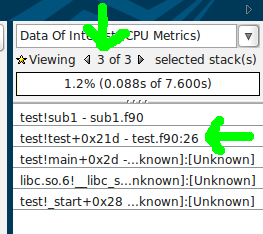
This is confirmed by checking the stack information on the right hand side of the screen, where both "contributions" are assigned to line 26 of test.f90:
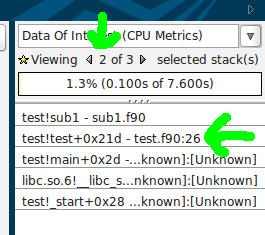
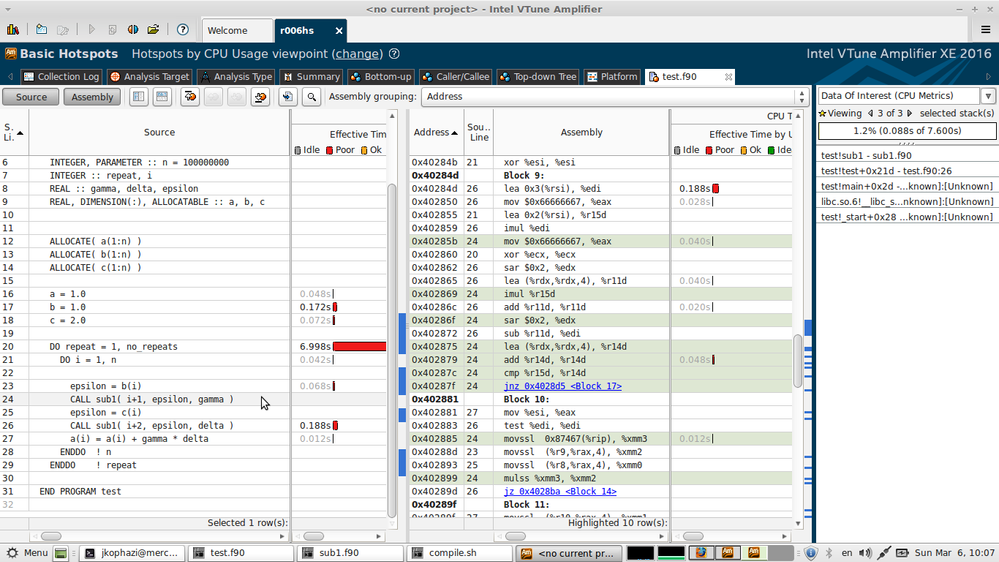
Moreover, when I check the assembly code and the times assigned to the machine instructions, all instructions belonging to both instantiation of sub1 seem to have some reasonable timings, but the lea at 0x40284d is attributed all time of both subroutines (0.188s; I do understand that the assembly level information is not necessarily precise due to the stochastic nature of this kind of performance testing and not using hardware counter based methods, but I still think it is a sign of something going to the wrong way):
Overall, my problem is that I can not check the time consumption of the individual instances of the inlined subroutines. The whole phenomenon can not be blamed on the fact that VTune sometimes attributes the time of an instruction to an other instruction nearby, often one or few instructions later, since inserting some complicated code after line 24 does not change the timings of sub1 and sub2. I have the impression that VTune is booking the time of the inlined code to the wrong place. A possible workaround would be to manually create a second copy of sub1 called sub2 and inline them separately. However, this is not working since the time of both sub1 and sub2 will be attributed to sub2. Furthermore, in a real program (a heavily inlined spagetti of some 100000 Fortran lines with OpenMP involved) this isn't feasible since the inlined subroutines are not small and their full call tree ,i.e. all called subroutines would have to be duplicated (triplicated, quadricated ...).
Is there some way to check these timings?
Thank you for your help,
Jozsef
Link Copied
- Mark as New
- Bookmark
- Subscribe
- Mute
- Subscribe to RSS Feed
- Permalink
- Report Inappropriate Content
-debug doesn't default to -debug:inline-debug-info, in case that was your question.
- Mark as New
- Bookmark
- Subscribe
- Mute
- Subscribe to RSS Feed
- Permalink
- Report Inappropriate Content
Dear Tim,
Thank you for your help. Unfortunately, when I replace "-debug full" with "-debug inline-debug-info", the problem still persist.
Jozsef
- Mark as New
- Bookmark
- Subscribe
- Mute
- Subscribe to RSS Feed
- Permalink
- Report Inappropriate Content
I can repeat this behavior, I work on -
[cpp]
> amplxe-cl --version
Intel(R) VTune(TM) Amplifier XE 2016 Update 2 (build 444464) Command Line Tool
Copyright (C) 2009-2015 Intel Corporation. All rights reserved.
> ifort --version
ifort (IFORT) 16.0.1 20151021 [/cpp]
I used compile_o3.h to build:
[cpp]
#!/bin/sh
ifort -c -no-vec -O3 -ipo -debug inline-debug-info sub2.f90
ifort -c -no-vec -O3 -ipo -debug inline-debug-info test.f90
ifort -no-vec -O3 -ipo -debug inline-debug-info sub2.o test.o -o test_o3 [/cpp]
Then, use basic hotspots to collect/display result:
[cpp]
>amplxe-cl -c hotspots -- ./test_o3 ; it lasted 8 seconds in my machine.
# amplxe-cl -R hotspots
amplxe: Using result path `/home/peter/problem_report/fort_inline/r009hs'
amplxe: Executing actions 75 % Generating a report Function CPU Time CPU Time:Effective Time CPU Time:Effective Time:Idle CPU Time:Effective Time:Poor CPU Time:Effective Time:Ok CPU Time:Effective Time:Ideal CPU Time:Effective Time:Over CPU Time:Spin Time CPU Time:Overhead Time Module Function (Full) Source File Start Address
-------- -------- ----------------------- ---------------------------- ---------------------------- -------------------------- ----------------------------- ---------------------------- ------------------ ---------------------- ------- --------------- ----------- -------------
test 7.770s 7.770s 0s 7.770s 0s 0s 0s 0s 0s test_o3 test test.f90 0x402e30
sub1 0.150s 0.150s 0s 0.150s 0s 0s 0s 0s 0s test_o3 sub1 sub2.f90 0x40305b
sub1 0.010s 0.010s 0s 0.010s 0s 0s 0s 0s 0s test_o3 sub1 sub2.f90 0x403050
amplxe: Executing actions 100 % done
[/cpp]
It seemed that sub1() only took ~0.15s but it didn't make sense. If I disabled all optimization, I can get expected result.
I used "sh compile_o0.sh" to build:
[cpp]
#!/bin/sh
ifort -c -no-vec -O0 -debug full sub2.f90
ifort -c -no-vec -O0 -debug full test.f90
ifort -no-vec -O0 -debug full sub2.o test.o -o test_o0 [/cpp]
I collected data & display report again:
[cpp]
> amplxe-cl -c hotspots -d 8 -- ./test_o0
> amplxe-cl -R hotspots
amplxe: Using result path `/home/peter/problem_report/fort_inline/r010hs'
amplxe: Executing actions 75 % Generating a report Function CPU Time CPU Time:Effective Time CPU Time:Effective Time:Idle CPU Time:Effective Time:Poor CPU Time:Effective Time:Ok CPU Time:Effective Time:Ideal CPU Time:Effective Time:Over CPU Time:Spin Time CPU Time:Overhead Time Module Function (Full) Source File Start Address
-------- -------- ----------------------- ---------------------------- ---------------------------- -------------------------- ----------------------------- ---------------------------- ------------------ ---------------------- ------- --------------- ----------- -------------
sub1 4.270s 4.270s 0s 4.270s 0s 0s 0s 0s 0s test_o0 sub1 sub2.f90 0x402e36
test 3.590s 3.590s 0s 3.590s 0s 0s 0s 0s 0s test_o0 test test.f90 0x402ea0
amplxe: Executing actions 100 % done
[/cpp]
CPU time of function sub1() was expected when disabling optimization.
Is it a bug from VTune(TM) Amplifier or from ifort?
- Mark as New
- Bookmark
- Subscribe
- Mute
- Subscribe to RSS Feed
- Permalink
- Report Inappropriate Content
I have forwarded this issue to developer, I will update when I get a solution.
- Mark as New
- Bookmark
- Subscribe
- Mute
- Subscribe to RSS Feed
- Permalink
- Report Inappropriate Content
Well, it is always hard to measure exact timings of inlined functions since compiler can significantly rearrange instructions doing optimizations. You can not rely on source view in this case because compiler may lose original source lines attribution.
Like in your case - you can see in VTune disassembly view that instructions of both inline instances are mixed together. There is release noted IP+1 issue (the time is attributed to the next instruction) which leads to attribution of imul timing of the first instance to the second one (attributed to add). Stack shows confusing source line because compiler wasn't accurate generating debug info for both instances - as I said, it is hard to preserve original source line attribution doing intensive optimizations.
- Mark as New
- Bookmark
- Subscribe
- Mute
- Subscribe to RSS Feed
- Permalink
- Report Inappropriate Content
Dear Vitaly, thank you for your help. I understand the troubles arising from the IP+1 issue and also I'm aware of the troubles of the performance measurement of heavily inlined and optimized code. I'm happy to browse the disassembled code to find the details and draw conclusions after some consideration.
However, I still think something is going wrong here and the bookkeping is buggy. Taking a look at the last two screenshots in my post it is visible that the second inlined copy of sub1 at line 26 took 0.188 s t complete. However, the first corresponding machine instruction, a lea at 0x40284d took exactly the same, 0.188 s. Then the time for the rest of the instructions (highlighted in the last screenshot by vtune) is not accounted anywhere. Similarly at the previous screenshot, vtune highlighted the instructions corresponding to the first call to sub1, the time of these instructions are more than zero but not accounted to the first call at the source view (the left side of the screen). Moreover, I think that the lea is irreasonably expensive here compared to the time needed by the floating point operations (hidden behind line 20 due to the IP+1 issue).
I have encountered several similar situations where the timings were sometimes obviously wrong. In one case the time of dozens of inlined subroutines have been attributed to a single inlined copy, in some other cases the output was completely unfeasible (a few pushq instructions before a function call were attributed a significant time while these were executed a total of seven times). The example I provided above is a simple demonstration for the core problem.
- Mark as New
- Bookmark
- Subscribe
- Mute
- Subscribe to RSS Feed
- Permalink
- Report Inappropriate Content
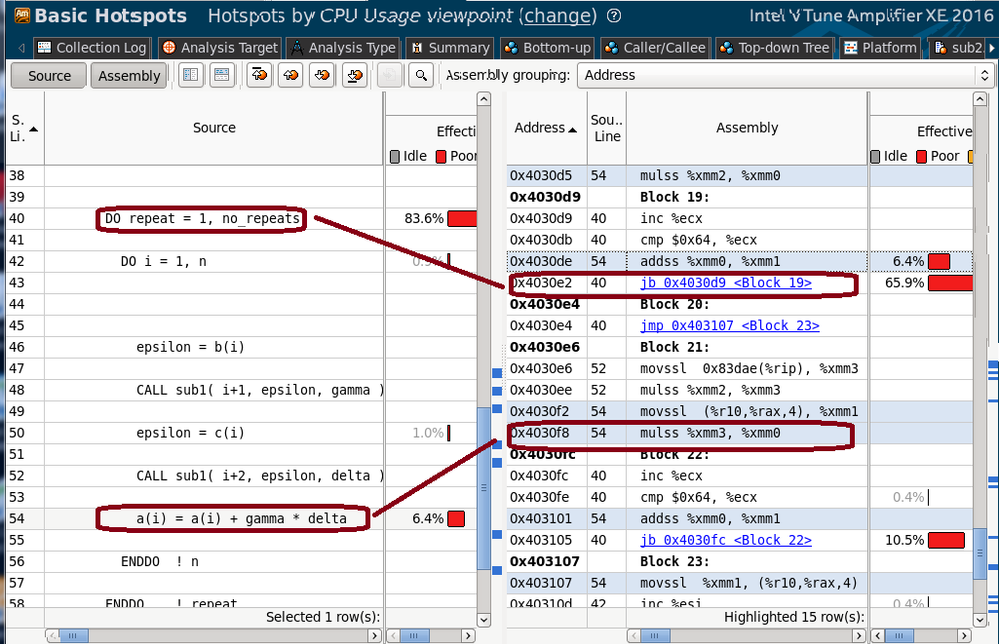
The problem on my side was, most of CPU time dropped on the entry of loop, others dropped on branch - it doesn't make sense. You can find clue by clicking on source line (you estimate it to take big CPU time), then find its associated assembly line. See the example of this case -
Line #54 has no CPU time, it was counted in line #40, but instruction address is 0x4030e2 -> 0x4030f8, IP + n?
0.18s CPU time on inline function is another issue.
- Mark as New
- Bookmark
- Subscribe
- Mute
- Subscribe to RSS Feed
- Permalink
- Report Inappropriate Content
After investigating this issue by developer. It seems this is a limitation for "-O3" used, not only for VTune.
During optimization stage, compiler can produce the code which doesn’t exactly reflect the source. Note that there are 5 loops in the binary code and the sub1 function has about 7 code ranges inserted to different places inside ‘test’ but not a single continuous code range.
I think it is not a VTune issue, other tools (for example perf) will show the same.
- Subscribe to RSS Feed
- Mark Topic as New
- Mark Topic as Read
- Float this Topic for Current User
- Bookmark
- Subscribe
- Printer Friendly Page
