- Mark as New
- Bookmark
- Subscribe
- Mute
- Subscribe to RSS Feed
- Permalink
- Report Inappropriate Content
I am doing analysis using VTune for an application, but I observed some problems with the numbers given by VTune. I observed that total number of RS_UOPS_DISPATCHED.CYCLES_NONE events (which counts the number of cycles during which no micro-op is dispatched for execution. ) is very much greater than CPU_CLK_UNHALTED.CORE events (which counts the number of core cycles while the core is not in a halt state. ) which should be happen in normal execution. I observed same problem with 5 applications.
Can you please comment on this behaviour of VTune?
Thanking you,
Regards,
Dny
Can you please comment on this behaviour of VTune?
Thanking you,
Regards,
Dny
Link Copied
8 Replies
- Mark as New
- Bookmark
- Subscribe
- Mute
- Subscribe to RSS Feed
- Permalink
- Report Inappropriate Content
Are you correcting for different sample-after values for the different events? For ease of comparison, you might set all the sample-after values to powers of 10.
- Mark as New
- Bookmark
- Subscribe
- Mute
- Subscribe to RSS Feed
- Permalink
- Report Inappropriate Content
Quoting - Dny
I am doing analysis using VTune for an application, but I observed some problems with the numbers given by VTune. I observed that total number of RS_UOPS_DISPATCHED.CYCLES_NONE events (which counts the number of cycles during which no micro-op is dispatched for execution. ) is very much greater than CPU_CLK_UNHALTED.CORE events (which counts the number of core cycles while the core is not in a halt state. ) which should be happen in normal execution. I observed same problem with 5 applications.
Can you please comment on this behaviour of VTune?
Thanking you,
Regards,
Dny
Can you please comment on this behaviour of VTune?
Thanking you,
Regards,
Dny
Hello,
I also observed that CPU_CLK_UNHALTED.CORE events are changing for multiple runs of profiling using VTune.
CPU_CLK_UNHALTED.CORE samples canges from 210 to 328703.
I used same binary for both run of sampling and same parameter.
Thanks,
Regards,
Dny
- Mark as New
- Bookmark
- Subscribe
- Mute
- Subscribe to RSS Feed
- Permalink
- Report Inappropriate Content
Quoting - Dny
I also observed that CPU_CLK_UNHALTED.CORE events are changing for multiple runs of profiling using VTune.
CPU_CLK_UNHALTED.CORE samples canges from 210 to 328703.
- Mark as New
- Bookmark
- Subscribe
- Mute
- Subscribe to RSS Feed
- Permalink
- Report Inappropriate Content
Quoting - tim18
You can't compare runs when calibration is repeated. Turn it off and set your own sample-after values. A change as large as you mention would appear to mean you have a run which failed to complete.
Hello Tim,
As I know VTune do not calibration step to set SAV for CPU_CLK_UNHALTED.CORE event, it is decided on clock frequency of processor (for my cpu its 3,000,000).
Secondly, I tested with another application and make sure that application will successfully.
I ran two sampling activities with my application and the only difference between two activities is the number of events I selected for sampling.
For first activity I had given following events
CPU_CLK_UNHALTED.CORE
INST_RETIRED.ANY
RS_UOPS_DISPATCHED.CYCLES_NONE
For second activity I had given following events
CPU_CLK_UNHALTED.CORE
INST_RETIRED.ANY
INST_RETIRED.LOADS
INST_RETIRED.STORES
RESOURCE_STALLS.BR_MISS_CLEAR
MEM_LOAD_RETIRED.L1D_LINE_MISS
MEM_LOAD_RETIRED.DTLB_MISS
MEM_LOAD_RETIRED.L2_LINE_MISS
RS_UOPS_DISPATCHED.CYCLES_NONE
UOPS_RETIRED.CYCLES_NONE
UOPS_RETIRED.ANY
UOPS_RETIRED.FUSED
RS_UOPS_DISPATCHED
RS_UOPS_DISPATCHED.CYCLES_ANY
SIMD_INST_RETIRED.ANY
I observe that for first sampling activity the CPU_CLK_UNHALTED.CORE events (not the samples) are 1,959,977,943,040 and for
second sampling activity CPU_CLK_UNHALTED.CORE events are 77,451,001,856.
So Why does changing the number of events for profiling are changing the value of CPU_CLK_UNHALTED.CORE ?
Is there any limitation for number of events to be sampled for a single sampling activity?
Thanking you,
Regards,
Dny.
- Mark as New
- Bookmark
- Subscribe
- Mute
- Subscribe to RSS Feed
- Permalink
- Report Inappropriate Content
Quoting - Dny
Hello Tim,
As I know VTune do not calibration step to set SAV for CPU_CLK_UNHALTED.CORE event, it is decided on clock frequency of processor (for my cpu its 3,000,000).
Secondly, I tested with another application and make sure that application will successfully.
I ran two sampling activities with my application and the only difference between two activities is the number of events I selected for sampling.
For first activity I had given following events
CPU_CLK_UNHALTED.CORE
INST_RETIRED.ANY
RS_UOPS_DISPATCHED.CYCLES_NONE
For second activity I had given following events
CPU_CLK_UNHALTED.CORE
INST_RETIRED.ANY
INST_RETIRED.LOADS
INST_RETIRED.STORES
RESOURCE_STALLS.BR_MISS_CLEAR
MEM_LOAD_RETIRED.L1D_LINE_MISS
MEM_LOAD_RETIRED.DTLB_MISS
MEM_LOAD_RETIRED.L2_LINE_MISS
RS_UOPS_DISPATCHED.CYCLES_NONE
UOPS_RETIRED.CYCLES_NONE
UOPS_RETIRED.ANY
UOPS_RETIRED.FUSED
RS_UOPS_DISPATCHED
RS_UOPS_DISPATCHED.CYCLES_ANY
SIMD_INST_RETIRED.ANY
I observe that for first sampling activity the CPU_CLK_UNHALTED.CORE events (not the samples) are 1,959,977,943,040 and for
second sampling activity CPU_CLK_UNHALTED.CORE events are 77,451,001,856.
So Why does changing the number of events for profiling are changing the value of CPU_CLK_UNHALTED.CORE ?
Is there any limitation for number of events to be sampled for a single sampling activity?
Thanking you,
Regards,
Dny.
Hello,
As per my understanding from VTune documents VTune can collect 4 events per run . If we give more number of events ten VTune run multiple sessions to collect different events.
When I given above event list to collection I observe that it is collecting only 2 events per run (except first run).
Please find the output of vtl command below
VTune Performance Analyzer 9.1 for Linux* build 226
Copyright (C) 2000-2009 Intel Corporation. All rights reserved.
The Activity has been successfully created.
The Activity is running.
Fri Jul 17 08:07:54 2009 127.0.0.1 (Run 0) Setting Sampling CPU mask to 0-7
Fri Jul 17 08:07:54 2009 127.0.0.1 (Run 0) The processor PMU configuration file: pmm.xml
Fri Jul 17 08:07:54 2009 127.0.0.1 (Run 0) Calibration for the following event(s) is being performed:
Fri Jul 17 08:07:54 2009 127.0.0.1 (Run 0) INST_RETIRED.LOADS, MEM_LOAD_RETIRED.L1D_LINE_MISS.
Fri Jul 17 08:21:55 2009 127.0.0.1 (Run 0) Setting Sampling CPU mask to 0-7
Fri Jul 17 08:21:55 2009 127.0.0.1 (Run 0) The processor PMU configuration file: pmm.xml
Fri Jul 17 08:21:56 2009 127.0.0.1 (Run 0) Collection for the following event(s) is being performed:
Fri Jul 17 08:21:56 2009 127.0.0.1 (Run 0) CPU_CLK_UNHALTED.CORE, INST_RETIRED.ANY, INST_RETIRED.LOADS, MEM_LOAD_RETIRED.L1D_LINE_MISS.
Fri Jul 17 08:36:44 2009 127.0.0.1 (Run 0) Sampling data was successfully collected.
Fri Jul 17 08:36:44 2009 127.0.0.1 (Run 1) Setting Sampling CPU mask to 0-7
Fri Jul 17 08:36:44 2009 127.0.0.1 (Run 1) The processor PMU configuration file: pmm.xml
Fri Jul 17 08:36:44 2009 127.0.0.1 (Run 1) Calibration for the following event(s) is being performed:
Fri Jul 17 08:36:44 2009 127.0.0.1 (Run 1) INST_RETIRED.STORES, MEM_LOAD_RETIRED.DTLB_MISS.
Fri Jul 17 08:50:45 2009 127.0.0.1 (Run 1) Setting Sampling CPU mask to 0-7
Fri Jul 17 08:50:45 2009 127.0.0.1 (Run 1) The processor PMU configuration file: pmm.xml
Fri Jul 17 08:50:45 2009 127.0.0.1 (Run 1) Collection for the following event(s) is being performed:
Fri Jul 17 08:50:45 2009 127.0.0.1 (Run 1) INST_RETIRED.STORES, MEM_LOAD_RETIRED.DTLB_MISS.
Fri Jul 17 09:05:29 2009 127.0.0.1 (Run 1) Sampling data was successfully collected.
Fri Jul 17 09:05:30 2009 127.0.0.1 (Run 2) Setting Sampling CPU mask to 0-7
Fri Jul 17 09:05:30 2009 127.0.0.1 (Run 2) The processor PMU configuration file: pmm.xml
Fri Jul 17 09:05:30 2009 127.0.0.1 (Run 2) Calibration for the following event(s) is being performed:
Fri Jul 17 09:05:30 2009 127.0.0.1 (Run 2) RESOURCE_STALLS.BR_MISS_CLEAR, MEM_LOAD_RETIRED.L2_LINE_MISS.
Fri Jul 17 09:19:31 2009 127.0.0.1 (Run 2) Setting Sampling CPU mask to 0-7
Fri Jul 17 09:19:31 2009 127.0.0.1 (Run 2) The processor PMU configuration file: pmm.xml
Fri Jul 17 09:19:31 2009 127.0.0.1 (Run 2) Collection for the following event(s) is being performed:
Fri Jul 17 09:19:31 2009 127.0.0.1 (Run 2) RESOURCE_STALLS.BR_MISS_CLEAR, MEM_LOAD_RETIRED.L2_LINE_MISS.
Fri Jul 17 09:34:09 2009 127.0.0.1 (Run 2) Sampling data was successfully collected.
Fri Jul 17 09:34:10 2009 127.0.0.1 (Run 3) Setting Sampling CPU mask to 0-7
Fri Jul 17 09:34:10 2009 127.0.0.1 (Run 3) The processor PMU configuration file: pmm.xml
Fri Jul 17 09:34:10 2009 127.0.0.1 (Run 3) Calibration for the following event(s) is being performed:
Fri Jul 17 09:34:10 2009 127.0.0.1 (Run 3) RS_UOPS_DISPATCHED.CYCLES_NONE, UOPS_RETIRED.CYCLES_NONE.
Fri Jul 17 09:48:09 2009 127.0.0.1 (Run 3) Setting Sampling CPU mask to 0-7
Fri Jul 17 09:48:09 2009 127.0.0.1 (Run 3) The processor PMU configuration file: pmm.xml
Fri Jul 17 09:48:09 2009 127.0.0.1 (Run 3) Collection for the following event(s) is being performed:
Fri Jul 17 09:48:09 2009 127.0.0.1 (Run 3) RS_UOPS_DISPATCHED.CYCLES_NONE, UOPS_RETIRED.CYCLES_NONE.
Fri Jul 17 10:02:39 2009 127.0.0.1 (Run 3) Sampling data was successfully collected.
Fri Jul 17 10:02:39 2009 127.0.0.1 (Run 4) Setting Sampling CPU mask to 0-7
Fri Jul 17 10:02:39 2009 127.0.0.1 (Run 4) The processor PMU configuration file: pmm.xml
Fri Jul 17 10:02:39 2009 127.0.0.1 (Run 4) Calibration for the following event(s) is being performed:
Fri Jul 17 10:02:39 2009 127.0.0.1 (Run 4) UOPS_RETIRED.ANY, UOPS_RETIRED.FUSED.
Fri Jul 17 10:16:39 2009 127.0.0.1 (Run 4) Setting Sampling CPU mask to 0-7
Fri Jul 17 10:16:39 2009 127.0.0.1 (Run 4) The processor PMU configuration file: pmm.xml
Fri Jul 17 10:16:39 2009 127.0.0.1 (Run 4) Collection for the following event(s) is being performed:
Fri Jul 17 10:16:39 2009 127.0.0.1 (Run 4) UOPS_RETIRED.ANY, UOPS_RETIRED.FUSED.
Fri Jul 17 10:31:20 2009 127.0.0.1 (Run 4) Sampling data was successfully collected.
Fri Jul 17 10:31:20 2009 127.0.0.1 (Run 5) Setting Sampling CPU mask to 0-7
Fri Jul 17 10:31:20 2009 127.0.0.1 (Run 5) The processor PMU configuration file: pmm.xml
Fri Jul 17 10:31:20 2009 127.0.0.1 (Run 5) Calibration for the following event(s) is being performed:
Fri Jul 17 10:31:20 2009 127.0.0.1 (Run 5) RS_UOPS_DISPATCHED, RS_UOPS_DISPATCHED.CYCLES_ANY.
Fri Jul 17 10:45:20 2009 127.0.0.1 (Run 5) Setting Sampling CPU mask to 0-7
Fri Jul 17 10:45:20 2009 127.0.0.1 (Run 5) The processor PMU configuration file: pmm.xml
Fri Jul 17 10:45:20 2009 127.0.0.1 (Run 5) Collection for the following event(s) is being performed:
Fri Jul 17 10:45:20 2009 127.0.0.1 (Run 5) RS_UOPS_DISPATCHED, RS_UOPS_DISPATCHED.CYCLES_ANY.
Fri Jul 17 11:00:02 2009 127.0.0.1 (Run 5) Sampling data was successfully collected.
The Activity has finished running.
Can you please explain why VTune not able to collect 4 events per run ?
Thanking you,
Regards,
Dny
- Mark as New
- Bookmark
- Subscribe
- Mute
- Subscribe to RSS Feed
- Permalink
- Report Inappropriate Content
Quoting - Dny
Can you please explain why VTune not able to collect 4 events per run ?
- Mark as New
- Bookmark
- Subscribe
- Mute
- Subscribe to RSS Feed
- Permalink
- Report Inappropriate Content
Quoting - Dny
I observe that for first sampling activity the CPU_CLK_UNHALTED.CORE events (not the samples) are 1,959,977,943,040 and for
second sampling activity CPU_CLK_UNHALTED.CORE events are 77,451,001,856.
second sampling activity CPU_CLK_UNHALTED.CORE events are 77,451,001,856.
Dny,
I've never seen such a big variation in event counts unless the application behaved differently between runs. Does the running time of your application also vary a lot? What do you observe in the task manager (or top on Linux)?
If you do two VTune measurements only with CPU_CLK_UNHALTED.CORE, what does VTune report where all the events come from? How many clockticks do you measure in the single threaded version? Is this in the same range?
Kind regards
Thomas
- Mark as New
- Bookmark
- Subscribe
- Mute
- Subscribe to RSS Feed
- Permalink
- Report Inappropriate Content
Quoting - Thomas Willhalm (Intel)
Dny,
I've never seen such a big variation in event counts unless the application behaved differently between runs. Does the running time of your application also vary a lot? What do you observe in the task manager (or top on Linux)?
If you do two VTune measurements only with CPU_CLK_UNHALTED.CORE, what does VTune report where all the events come from? How many clockticks do you measure in the single threaded version? Is this in the same range?
Kind regards
Thomas
Hello Sir,
I tried two sampling activities for application.
Following are the command I used for first and second activity
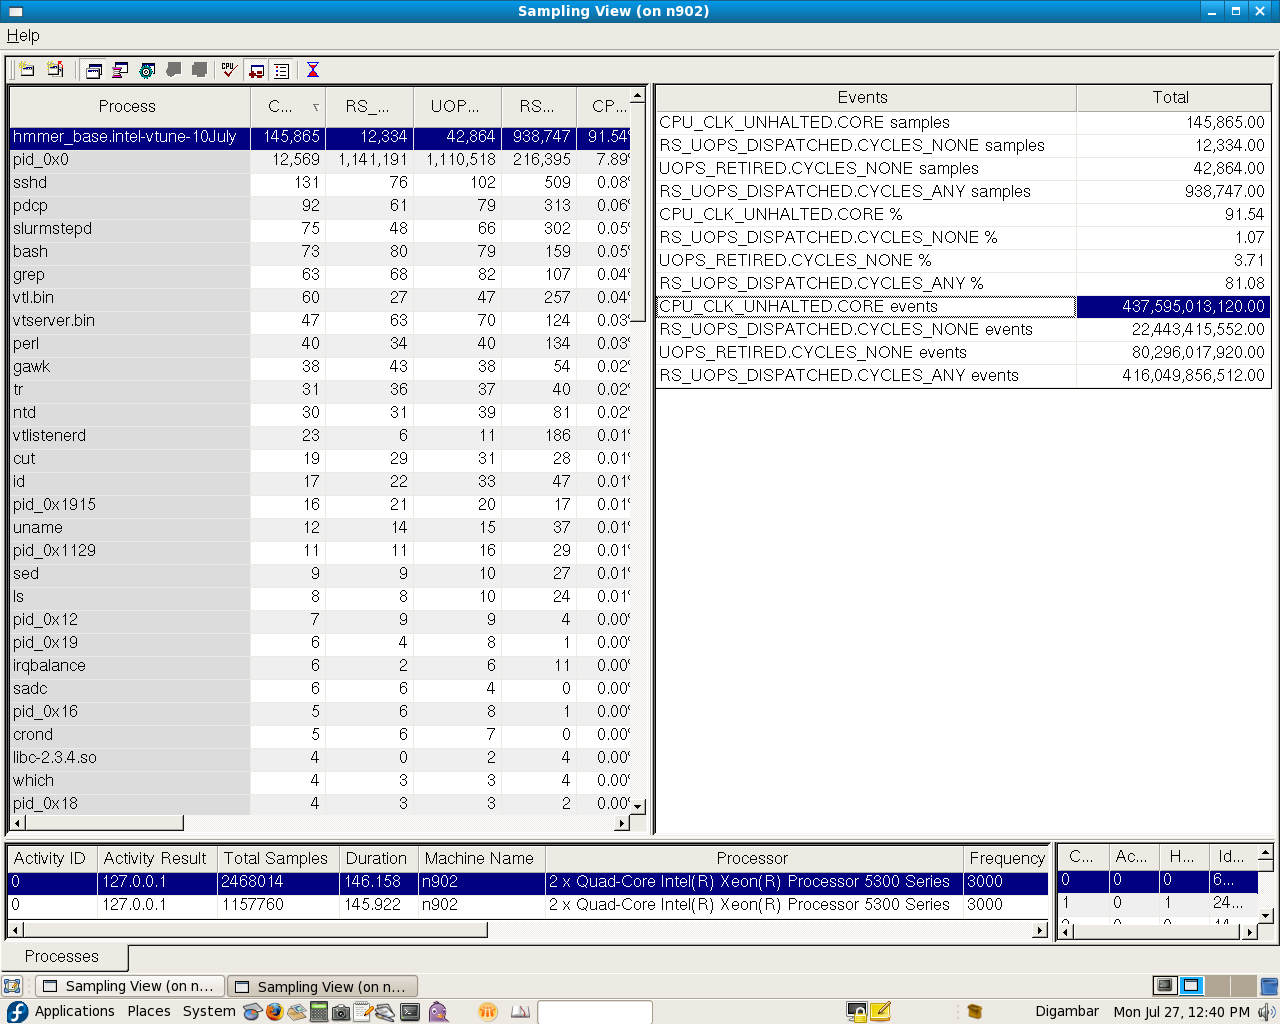
1) vtl activity test_hmmer -d 3600 -c sampling -o "-ec en=CPU_CLK_UNHALTED.CORE en=RS_UOPS_DISPATCHED.CYCLES_NONE en=UOPS_RETIRED.CYCLES_NONE en=RS_UOPS_DISPATCHED.CYCLES_ANY" -app ./hmmer_base.intel-vtune-10July,"nph3.hmm swiss41" run
2) vtl activity test_hmmer2 -d 3600 -c sampling -o "-ec en=CPU_CLK_UNHALTED.CORE en=INST_RETIRED.ANY en=INST_RETIRED.LOADS en=INST_RETIRED.STORES en=RESOURCE_STALLS.BR_MISS_CLEAR en=MEM_LOAD_RETIRED.L1D_LINE_MISS en=MEM_LOAD_RETIRED.DTLB_MISS en=MEM_LOAD_RETIRED.L2_LINE_MISS en=RS_UOPS_DISPATCHED.CYCLES_NONE en=UOPS_RETIRED.CYCLES_NONE en=UOPS_RETIRED.ANY en=UOPS_RETIRED.FUSED en=RS_UOPS_DISPATCHED en=RS_UOPS_DISPATCHED.CYCLES_ANY en=SIMD_INST_RETIRED.ANY" -app ./hmmer_base.intel-vtune-10July,"nph3.hmm swiss41" run
My observation is that in first activity is showing correct number of events for Total number of CPU clock cycles.
(i.e., CPU_CLK_UNHALTED.CORE ~ RS_UOPS_DISPATCHED.CYCLES_NONE + RS_UOPS_DISPATCHED.CYCLES_ANY)
but second activity is showing very less number of events for Total number of CPU clock cycles (i.e. CPU_CLK_UNHALTED.CORE) , though the RS_UOPS_DISPATCHED.CYCLES_NONE and RS_UOPS_DISPATCHED.CYCLES_ANY are approx. same.
The only difference between these two activities is the number of sampling event, even both the activities need more than two run to complete the sampling (first activity needed 2 runs and second 6 runs).
Find the screen shots for event numbers.
Thanking you,
Regards,
Digambar
Reply
Topic Options
- Subscribe to RSS Feed
- Mark Topic as New
- Mark Topic as Read
- Float this Topic for Current User
- Bookmark
- Subscribe
- Printer Friendly Page