- Mark as New
- Bookmark
- Subscribe
- Mute
- Subscribe to RSS Feed
- Permalink
- Report Inappropriate Content
I selected 'Attach to process' option to run my .exe application. I am not getting any log which is related to my application.
For getting the functions and other details should I run application from the IDE with source code?
Thanks
Link Copied
- Mark as New
- Bookmark
- Subscribe
- Mute
- Subscribe to RSS Feed
- Permalink
- Report Inappropriate Content
Hi,
Thank you for posting in Intel Communities.
All logs will be generated in the location "<VTune_installed_location>\VTune\Projects\sample (matrix)" if it has ran successfully.
Please make sure to run your application under the same analysis and make sure it runs without errors or unexpected exits.
Could you confirm which type of workload you are trying out. If your workload is too short and did not collect enough samples, it might not be able to get analyzed by Intel VTune profiler. In such cases try increase the analysis duration to at least 3-5 minutes.
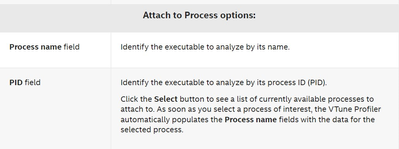
Specify the name or PID of a process that is currently running as an analysis target and configure the target properties, if required.
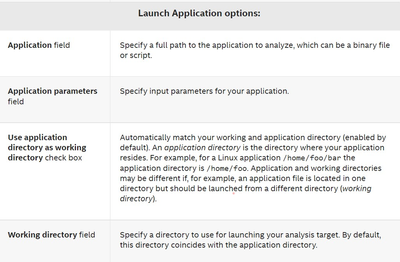
You can try " Launch Application " also, where you can specify a full path to the application to analyze, which can be a binary file or script.
Please refer the below link
For getting the functions and other details you can run Intel VTune Profiler using the below methods:
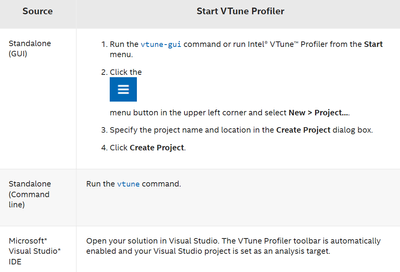
1) If you are using Windows* OS
--------------------------------------
Start Intel VTune Profiler through one of these ways and set up a project. A project is a container for the application you want to analyze, the type of analysis, and data collection results.
Reference link : https://www.intel.com/content/www/us/en/develop/documentation/get-started-with-vtune/top/windows-os.html
Example: Profile an OpenMP* Application on Windows*
Example: Profile a DPC++ Application on Windows*
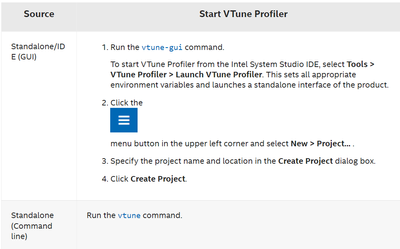
2) If you are using Linux* OS
---------------------------------
Start Intel VTune Profiler through one of these ways:
Reference link : https://www.intel.com/content/www/us/en/develop/documentation/get-started-with-vtune/top/linux-os.html
Example: Profile an OpenMP Application on Linux*
Example: Profile a DPC++ Application on Linux*
3) If you are using macOS system
--------------------------------------
Use Intel VTune Profiler on a macOS system to perform remote target analysis on a non-macOS system (Linux* or Android* only) .
You cannot use Intel VTune Profiler in a macOS environment for these purposes:
* Profile the macOS system on which it is installed.
* Collect data on a remote macOS system.
To analyze performance of a remote Linux* or Android* target from the macOS host, do one of these steps:
* Run a VTune Profiler analysis on the macOS system with a remote system specified as the target. When analysis begins, Intel VTune Profiler connects to the remote system to collect data, then brings the results back to the macOS host for viewing.
*Run an analysis on the target system locally and copy the results to a macOS system for viewing in Intel VTune Profiler.
Reference link : https://www.intel.com/content/www/us/en/develop/documentation/get-started-with-vtune/top/macos.html
If this not resolve your issue, please let us know
1) The Operating System you are using.
2) The Intel VTune profiler version in which you are trying out.
3) Whether your workload is too short and did not collect enough samples.
Thanks
- Mark as New
- Bookmark
- Subscribe
- Mute
- Subscribe to RSS Feed
- Permalink
- Report Inappropriate Content
Hi,
Is your issue resolved? Could you please give us an update ?
Thanks
- Mark as New
- Bookmark
- Subscribe
- Mute
- Subscribe to RSS Feed
- Permalink
- Report Inappropriate Content
Hi,
We have not heard back from you. This thread will no longer be monitored by Intel. If you need further assistance, please post a new question.
Thanks
- Subscribe to RSS Feed
- Mark Topic as New
- Mark Topic as Read
- Float this Topic for Current User
- Bookmark
- Subscribe
- Printer Friendly Page


