- Mark as New
- Bookmark
- Subscribe
- Mute
- Subscribe to RSS Feed
- Permalink
- Report Inappropriate Content
I've successfully installed VTune Amplifier XE 2013 on a CentOS. I wrote a simple test program with a while loop for each second. Then I used this command to collect data:
./amplxe-cl -collect locksandwaits -r /data/home/davidzhou/vtuneresults -target-process=test
after that, I put the results on my windows machine, opened with vtune and saw nothing. summay only indicated platform info, call stack was empty....
Would you please help me this? Thank you!
Link Copied
- Mark as New
- Bookmark
- Subscribe
- Mute
- Subscribe to RSS Feed
- Permalink
- Report Inappropriate Content
Hi david z.:
First, try letting VTune Amplifier launch the app, with this command line:
./amplxe-cl -collect locksandwaits -r <results-dir> -- <path-to-app>/test
BTW, for how long does your test app execute when run normally (i.e., without VTune Amplifier)?
Also, note, there are sample apps included with the VTune Amplifier XE. I always suggest building one of those and testing with it. We know that those apps work with our tool and, therefore, can confirm that the installation of VTune Amplifier is correct.
- Mark as New
- Bookmark
- Subscribe
- Mute
- Subscribe to RSS Feed
- Permalink
- Report Inappropriate Content
Dear MrAnderson,
I've tried with Matrix sample with command:
./amplxe-cl -collect locksandwaits -r testresults -- matrix.gcc
I could see some information in "Summary", like Elapsed Time, Thread Concurrency Histogram, CPU Usage Histogram, etc. Although, the "Function/Call Stack" has "No stack information". Does this mean I have a problem with my VTune linux installation?
My target program is a server application, so I need to attach to that. How can I make attaching work?
- Mark as New
- Bookmark
- Subscribe
- Mute
- Subscribe to RSS Feed
- Permalink
- Report Inappropriate Content
@ David z,
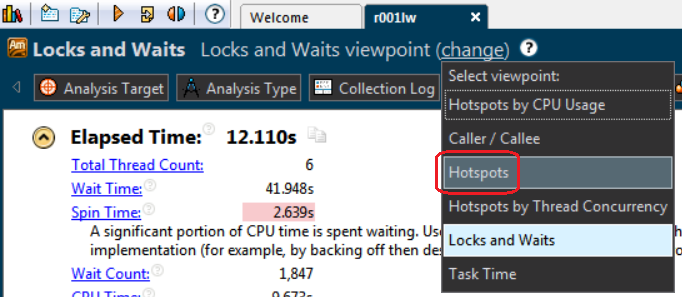
LocksAndWaits analysis is designed to profile wait time / wait count of sync-objects (or IO wait) in your application. Both your application of loop and matrix app might not have any locks and no wait time, that was why the result was empty. You might change "view point" to Hotspots view, so there should be hot functions displayed in bottom-up report,
You can use LocksAndWaits in attach mode, like this:
amplxe-cl -collect locksandwaits -r result-dir -target -process program
- Mark as New
- Bookmark
- Subscribe
- Mute
- Subscribe to RSS Feed
- Permalink
- Report Inappropriate Content
Dear Peter Wang,
I've tried with "hotspots" on sample program "matrix" and the call stack looks beautiful. But attaching to my server application still output nothing. I used this command:
amplxe-cl -collect hotspots -r result-dir -target-process serverprogram
and after running this command a little while, I used Ctrl-C to stop and generate results.
Did I get anything wrong?
- Mark as New
- Bookmark
- Subscribe
- Mute
- Subscribe to RSS Feed
- Permalink
- Report Inappropriate Content
@david z.
Peter was referring to the viewpoint "Hotspots", available when analyzing Locks and Waits data (click on change, then Hotspots):
Regarding your collection, you say it is a server app. Can you describe it in more detail? For example, is it written entirely in C, C++, or Fortran? If it is a server app, how is it started? Who is the owner of the process, once it is started? Does it run with elevated privileges?
- Mark as New
- Bookmark
- Subscribe
- Mute
- Subscribe to RSS Feed
- Permalink
- Report Inappropriate Content
@ David z
Mr.Anderson is right. I didn't let you try Hotspots collector, just change viewpoint in result.
First at all, ensure that you "loop" app & matrix can work with VTune by using launch mode. Secondary, try your server app - my tip is to ensure that user account (run VTune) has privilege to profile running server app, it's better that VTune and server app are invoked by same user account.
- Subscribe to RSS Feed
- Mark Topic as New
- Mark Topic as Read
- Float this Topic for Current User
- Bookmark
- Subscribe
- Printer Friendly Page
