- Mark as New
- Bookmark
- Subscribe
- Mute
- Subscribe to RSS Feed
- Permalink
- Report Inappropriate Content
We try to migrate a project from openmp and CUDA to dpc++ on remote Linux.
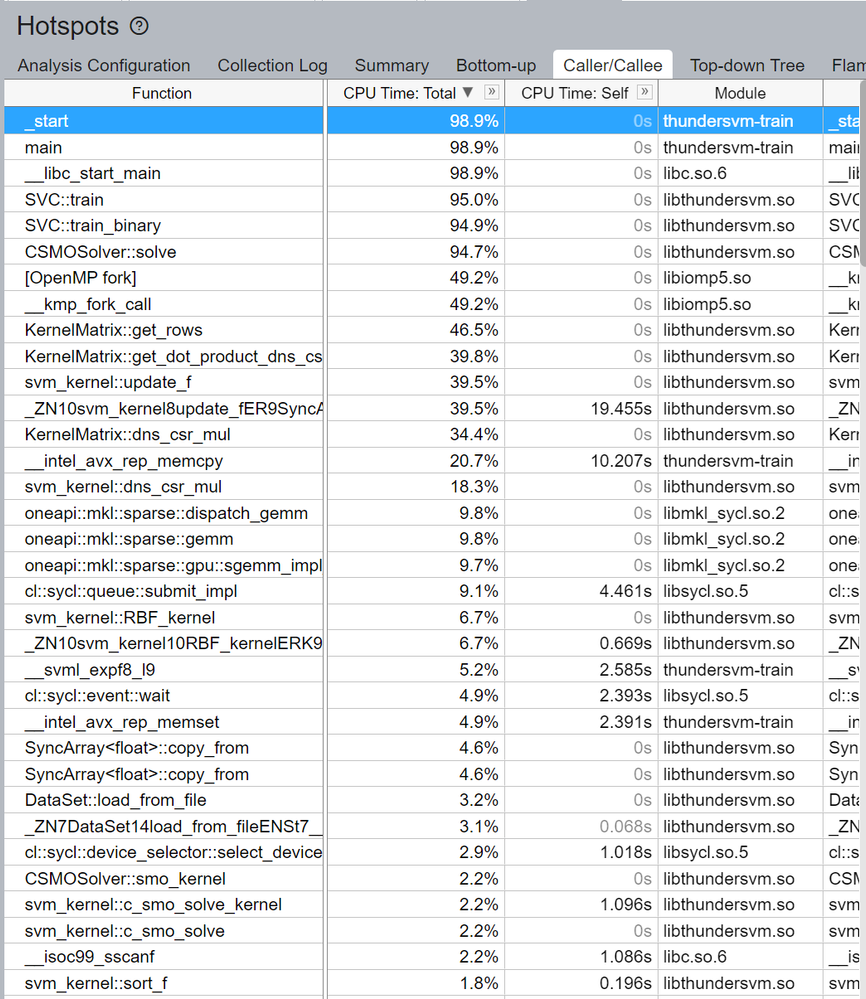
Firstly, we used a sparse matrix multiplication function to replace the old CUDA kernel. Then we profiled it by Vtune and we can see the function name.
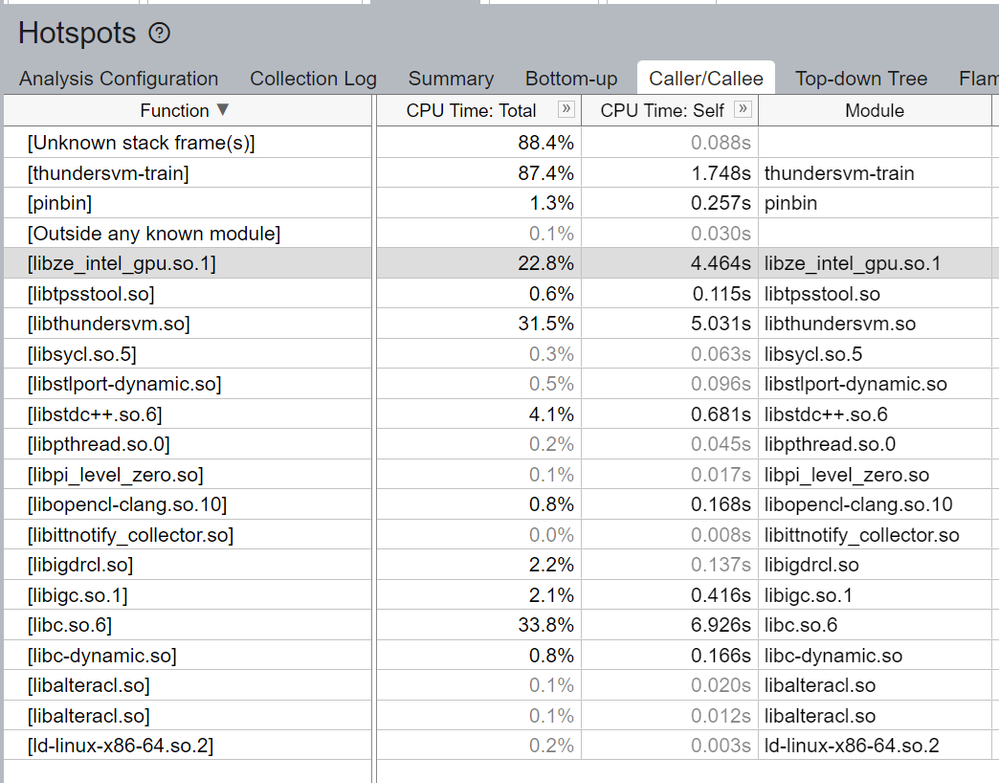
However, we replace a piece of OpenMP code by parallel_for(dpc++), we found we cannot see the function name and there is only library name.
Link Copied
- Mark as New
- Bookmark
- Subscribe
- Mute
- Subscribe to RSS Feed
- Permalink
- Report Inappropriate Content
Hi,
Thank you for posting in Intel Communities.
For dpc++ you can use any debug parameters while compiling -gline-tables-only and -fdebug-info-for-profiling , so it will show the information
Please refer the documentation if needed:
(Or) If program is taking negligible amount of time to run, also cause this kind of issue.
Thanks
Shyam Sundar
- Mark as New
- Bookmark
- Subscribe
- Mute
- Subscribe to RSS Feed
- Permalink
- Report Inappropriate Content
Hi,
Could you please provide any updates.
Thanks
Shyam Sundar
- Mark as New
- Bookmark
- Subscribe
- Mute
- Subscribe to RSS Feed
- Permalink
- Report Inappropriate Content
Hi,
I assume that your issue is resolved. If you need any additional information, please post a new question as this thread will no longer be monitored by Intel.
Thanks
Shyam Sundar
- Subscribe to RSS Feed
- Mark Topic as New
- Mark Topic as Read
- Float this Topic for Current User
- Bookmark
- Subscribe
- Printer Friendly Page

