- Mark as New
- Bookmark
- Subscribe
- Mute
- Subscribe to RSS Feed
- Permalink
- Report Inappropriate Content
Hello,
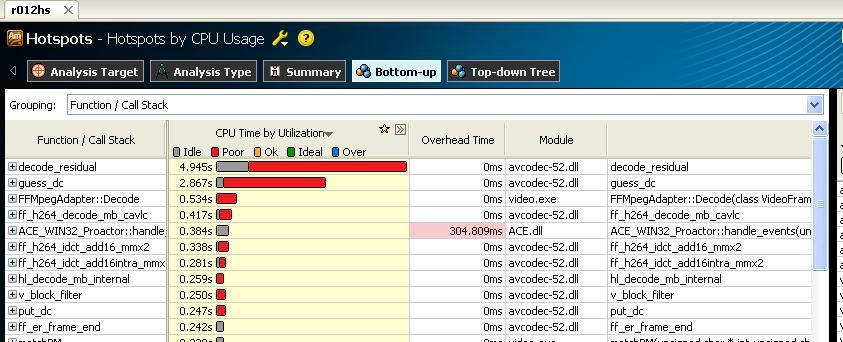
I'm using VTune Amplifier XE to profile video decoding application. I've used Hotspot analyze to find heavy functions CPU time and was suprising when 'hotspots by CPU usage' had shown Idle usage (gray blocks)as part of the functions CPU time:
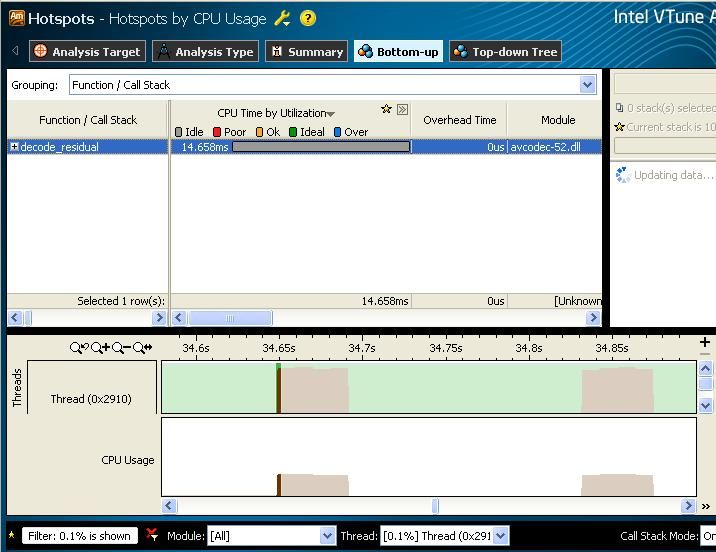
Next, I had thought the Idle CPU usage comes from some multithreading/synchronization issues when a thread has Ready state but doesn't received CPU time. But, digging deeper I've found the Idle time comes from edge where the periodically called functions become active:
Doesthe Idle time result from measurement granulation (OS scheduller tick period)or some other measurement inaccuracyor the thread really doesnt receive CPU after it was ready certain time duration?
How Amplifier determinates CPU state (Idle or Running) at sample extraction? (By means of NtQuerySystemInformation, or some NtQueryInformationXXX?)
Link Copied
- Mark as New
- Bookmark
- Subscribe
- Mute
- Subscribe to RSS Feed
- Permalink
- Report Inappropriate Content
First at all, pleaseuse latest product - VTune Amplifier XE 2011 XE Update 6.
If you use Hotspots analysis - that is user-mode data collection, use OS Timer's ticks toprofile.
1. In your screen-shot, I guessthat the program has many threads but parallelism is not good ("Red bar": parallel-working-threads / cores < 50%)
2. I don't know why two reports of "Hotspots by CPU Usgae" have different results, for same app?
3. You can use the group of "Function/Thread/Call Stack" to verify CPU usage in each thread of hot function
4. Explain bar of "Idle", the reasons could be:
4.a. Hotfunction is active, but data is not ready (e.g. read from disk)
4.b. Hot functionisactive (and the state of thread is ready), but more other threads are running, so this threaddidn't getCPU time granted.
4.c.CPU time may spend on other system dlls, 3rd-party libraries (light-workin decode function, mayAPI only?)
4.d. Other situation?
5. I think that you can change "Call Stack Mode:" to "User/system functions", it will display more info
If you still can't explain results, please attach zip file which are for "result directory" - I would like to look into.
Thanks, Peter
- Mark as New
- Bookmark
- Subscribe
- Mute
- Subscribe to RSS Feed
- Permalink
- Report Inappropriate Content
butfor now I am sure the Idle time comes from measurement inaccuracy of Amplifier:
Let's consider a very simply code and'hotspots by CPU usage' result gathering by VTune Amplifier:
do
{
Sleep(20);
unsigned sum = 0;
for (unsigned i = 0; i < 0xfffff; i++)
sum += i;
} while (true);
I am willing to concede that sum loop complete faster 15ms (OS scheduler tick period) so it's CPU time would be more than indeed but why we see Idle usage? I don't believe the Idle time results from overheadinring 0when scheduler redispatches threads due to Sleep(20) and my thread doesn't receive CPU time being Ready, because it would be visible as kernel mode CPU load in task manager.
Could you explain this?Does it result from user mode sampling and tracing specific character?
I'am using VTune Amplifier XE 2011 Update 5. I didn't find Update 6 on Intel site.
- Mark as New
- Bookmark
- Subscribe
- Mute
- Subscribe to RSS Feed
- Permalink
- Report Inappropriate Content
C:\temp>amplxe-cl -collect hotspots -duration 5 -- idle_test.exe
You saw "grayed" long-bar indicator in "Hotspots by CPU Usgae", which meant it consumed CPU time is low, it didn't mean most of time is in CPU IDLE.

You can verifyby changingview to "Hotspots", it is about CPU time 866ms in my case.main() was running, but consumed CPU low.

Howevertotal CPU time is less than 5s (elapsed time), why? Because hotspots only collects performance datafor user mode target application, other modules also consumed CPU time. So,
C:\temp>amplxe-cl -collect lightweight-hotspots -analyze-system -duration 5 -- idle_test.exe
You will find other modules which also received CPU time, during your data collection.
In conclusion, your main thread is active, but CPUusage is low, other active modules (other applications and system modules)in system consumed rest of CPU time.
If you change code in loop as :
double a[1024], b[1024], c[1024];
....
c = a*b;
Program will consume CPU high.
Regards, Peter
- Subscribe to RSS Feed
- Mark Topic as New
- Mark Topic as Read
- Float this Topic for Current User
- Bookmark
- Subscribe
- Printer Friendly Page

