- Mark as New
- Bookmark
- Subscribe
- Mute
- Subscribe to RSS Feed
- Permalink
- Report Inappropriate Content
Hi there,
I am trying to get detailed information of the integrated GPU and have followed the steps to create custom kernel for the i915 driver config so that the low_level_ftraces would be enabled.
However, after having done so when installing intel_graphics_runtime the following error shows up on the vtune application. Can anyone help me to fix this? I have tried different approaches to install drivers and stuff but they wont help.
Error:
Thank you.
- Mark as New
- Bookmark
- Subscribe
- Mute
- Subscribe to RSS Feed
- Permalink
- Report Inappropriate Content
Hi,
Thank you for the follow up. Unfortunately the issue was not resolved!
However, I tried to use the openvino and vtune applications on different Linux machines and this solved my problem for the time being.
Thank you very much!
Regards,
Behzad
Link Copied
- Mark as New
- Bookmark
- Subscribe
- Mute
- Subscribe to RSS Feed
- Permalink
- Report Inappropriate Content
Hi,
Thank you for posting in Intel communities.
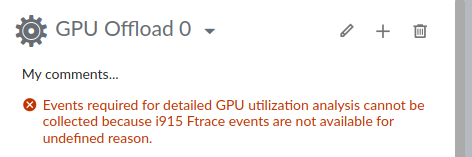
You are probably getting this error because your Linux kernel should be properly configured to collect i915 ftrace events that are required for a detailed analysis of GPU utilization.
Please try to follow the steps mentioned in this document step by step to Rebuild and Install the Kernel for GPU Analysis so that the error is fixed.
If this resolves your issue, make sure to accept this as a solution. This would help others with similar issues.
But if you still face any issues, please connect back to us with the following details:
1. Sample reproducer code.
2. VTune version.
3. Exact steps and the commands used.
4. OS details.
5. Processor and kernel details.
6. Screenshots of the error you got.
7. Result directory
8. Self-checker logs.
To get the self-checker logs you have to make sure that the VTune self-checker script is running fine. This is to validate that appropriate drivers are installed and the system is set up properly to collect the performance data.
The "vtune-self-checker.sh" script is available from <install-dir>/bin64 on the Windows or Linux system on which you installed VTune Profiler.
On running this script, it will create a log file and display the location of the log file. Kindly share that file with us so that we can verify it from our side.
Thanks and Regards,
Diya
- Mark as New
- Bookmark
- Subscribe
- Mute
- Subscribe to RSS Feed
- Permalink
- Report Inappropriate Content
Dear Diya,
Thank you for your early reply. I have used the documentation you have provided to configure the kernel to get i915 profiling data and it fixes the problem.
However after installing intel-graphics-compiler and OpenCl drivers to use Intel's Openvino toolkit then the mentioned problem rises again even with the configured kernel.
I will try the self-checker to see if everything is set properly after I have installed the other tools if the problems is still not fixed I will connect back.
Thank you again for your time.
Behzad
- Mark as New
- Bookmark
- Subscribe
- Mute
- Subscribe to RSS Feed
- Permalink
- Report Inappropriate Content
Hi,
We have not heard back from you.
Is your issue being resolved?
Did you try the self-checker script?
If you still have doubts you can connect back to us.
And if your issue is resolved please let us know as well.
Thanks and Regards,
Diya
- Mark as New
- Bookmark
- Subscribe
- Mute
- Subscribe to RSS Feed
- Permalink
- Report Inappropriate Content
Hi,
Dear Diya,
Self-checker provides valuable information! However, I was not able to fix the problem yet here is the report of the self-checker I get:
"""
Checking DPC++ application as prerequisite for GPU analyses: Fail
Unable to run DPC++ application on GPU connected to this system. If you are using an Intel GPU and want to verify profiling support for DPC++ applications, check these requirements:
* Install Intel(R) GPU driver.
* Install Intel(R) Level Zero GPU runtime.
* Install Intel(R) oneAPI DPC++ Runtime and set the environment.
The system is ready to be used for performance analysis with Intel VTune Profiler.
Review warnings in the output above to find product limitations, if any.
The system is ready for the following analyses:
* Performance Snapshot
* Hotspots and Threading with user-mode sampling
* Hotspots with HW event-based sampling, HPC Performance Characterization, etc.
* Microarchitecture Exploration
* Memory Access
* Hotspots with HW event-based sampling and call stacks
* Threading with HW event-based sampling
The following analyses have failed on the system:
* GPU Compute/Media Hotspots (characterization mode)
* GPU Compute/Media Hotspots (source analysis mode)
"""
I tried to install the GPU driver, Level Zero GPU runtime, and oneAPI DPC++ Runtime and set the environment again but it did not fix it.
Thank you again.
Best Regards,
Behzad
- Mark as New
- Bookmark
- Subscribe
- Mute
- Subscribe to RSS Feed
- Permalink
- Report Inappropriate Content
Hi,
Thank you for sending the self-checker log.
Could you please share the mentioned details so that we can try to investigate the issue further from our end?
1. Sample reproducer code.
2. VTune version.
3. Exact steps and the commands used.
4. OS details.
5. Processor and kernel details.
6. Screenshots of the error you got.
7. Result directory
In addition to that please try this workaround as your GPU analysis is failing.
As the GPU analysis is failing we need to update the kernel version.
In this link, please give all the commands one by one to install all the necessary packages and reboot the system.
After upgrading you can check that the kernel version is updated to 5.19.0-41-generic.
The next step is to build and install Intel(R) Metrics Discovery Application Programming Interface.
Please follow all the steps mentioned in this link .
Then when you can run the self-checker script file to check if there is any failed analysis happening.
Please let us know if you face any further issues.
And if your issue is resolved please let us know as well.
Thanks and Regards,
Diya
- Mark as New
- Bookmark
- Subscribe
- Mute
- Subscribe to RSS Feed
- Permalink
- Report Inappropriate Content
Dear Diya,
I will try the workaround and if the issue persists will let you know about it. Meanwhile these are the information you have requested.
Vtune 2023.2.0
Followed the steps for installing there was in the Intel oneAPI Toolkit installation guide (and for clarification these issues started to exist as I have mentioned in the first post when installing intel_graphics_runtime to use it for openvino application)
ubuntu 22.04.2 LTS
11th Gen Intel Core i7-11700k 3.60 GHz
5.19.0-46-generic
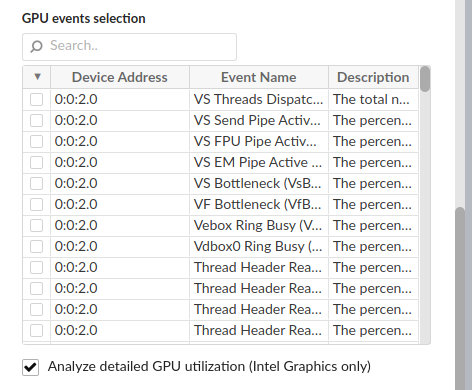
This is the problem that occurs in Screenshot from 2023-07-28 15-33-50.png when trying to get the information in Screenshot from 2023-07-28 15-34-05.png.
result directory is in my /home/user/results/
Thank you very much for your time and help.
Best,
Behzad
- Mark as New
- Bookmark
- Subscribe
- Mute
- Subscribe to RSS Feed
- Permalink
- Report Inappropriate Content
Hi,
We have not heard back from you.
Did the workaround help you in resolving your issue?
If it has resolved your issue, please make sure to accept this as a solution.
This would help others with similar issues. Thank you!
Regards,
Diya
- Mark as New
- Bookmark
- Subscribe
- Mute
- Subscribe to RSS Feed
- Permalink
- Report Inappropriate Content
Hi,
Thank you for the follow up. Unfortunately the issue was not resolved!
However, I tried to use the openvino and vtune applications on different Linux machines and this solved my problem for the time being.
Thank you very much!
Regards,
Behzad
- Mark as New
- Bookmark
- Subscribe
- Mute
- Subscribe to RSS Feed
- Permalink
- Report Inappropriate Content
Hi,
Glad to know that you were able to solve the issue by moving to a different Linux machine.
If you need any additional information, please post a new question as this thread will no longer be monitored by Intel.
Regards,
Diya
- Subscribe to RSS Feed
- Mark Topic as New
- Mark Topic as Read
- Float this Topic for Current User
- Bookmark
- Subscribe
- Printer Friendly Page