- Mark as New
- Bookmark
- Subscribe
- Mute
- Subscribe to RSS Feed
- Permalink
- Report Inappropriate Content
Dear all,
I am trying to detect memory leakage problem using Intel Inspector XE. After the inspection finished, the resuls shows several memory leakage problems. However, by double clicking the problem item I was brought to the assemble code, instead of the source code. I also noticed that a warning message displayed:
symbol information not found. suggestion: specify locations in a project properties dialog box search tab, then re-resolve the result.
I have already set binary file folders and source code folders from 'project properties' dialog box in inspector's windows.
Is there any problem in my setting and usage of Intel Inspector XE, how can I locate to the code that have the memory leakage problem?
Thanks,
Tang Laoya
Link Copied
- Mark as New
- Bookmark
- Subscribe
- Mute
- Subscribe to RSS Feed
- Permalink
- Report Inappropriate Content
What is your system environment? Windows or Linux?
1. Please ensure if you use right compiler's option to build to generate debugging info. Use "/Zi" with linker's option "/DEBUG" to generate .pdb file in Windows, use "-g" option in Linux.
2. If you worked in Windows, please set right path of pdb file in project to do like "inspxe-cl -finalize -search-dir all:rp=dir1 -r result-dir" in command line simply.
3. If you cannot solve the problem, can send me inspector's result dir, binary/debug file(s), and problem related source via private message for investigating?
BTW, can this problem be produced in latest 2016 version Update 1?
- Mark as New
- Bookmark
- Subscribe
- Mute
- Subscribe to RSS Feed
- Permalink
- Report Inappropriate Content
Dear Peter Wang,
Thank you very much for your kindly reply. I used /DEBUG option, but where to set /Zi option?
I worked in Windows 7 64bit + VS 2013 + Intel Spector XE 2015 update 1, the project is a Fortran/C++ mixed project and the Fortran is main program and C++ generate a DLL file used by main program. The Inspector result looks like the attached picture.
For the command line, I click the command line buttom and it displayed the following message:
inspxe-cl -collect mi3 -knob detect-uninit-read=false -knob revert-uninit=false -knob analyze-stack=false -knob detect-leaks-on-exit=true -knob detect-resource-leaks=true -knob enable-memory-growth-detection=true -knob enable-on-demand-leak-detection=true -knob remove-duplicates=true -knob still-allocated-memory=true -knob stack-depth=16 -mrte-mode=auto -module-filter-mode=include -app-working-dir Z:\memtest -- "E:\Users\tang\fem\x64\Debug\fem.exe"
Is there anything missed?
I haven't test the later 2016 version.
Thanks,
Tang Laoya
- Mark as New
- Bookmark
- Subscribe
- Mute
- Subscribe to RSS Feed
- Permalink
- Report Inappropriate Content
- Mark as New
- Bookmark
- Subscribe
- Mute
- Subscribe to RSS Feed
- Permalink
- Report Inappropriate Content
From Intel's compiler helper -
"/Zi, /ZI, /Z7" one of them will be used to build your Fortran code.
Produce symbolic debug information. The /Zi and /ZI flags emit the debug information for types into a separate PDB file.
Have you found .pdb file?
There were many default options in you command line, simply use - "inspxe-cl -c mi3 -- fem.exe"
- Mark as New
- Bookmark
- Subscribe
- Mute
- Subscribe to RSS Feed
- Permalink
- Report Inappropriate Content
Dear Peter Wang,
Thank you very much for your kindly reply. I noticed that the /Zi and /debug:full options are for C++ and Fortran respectively. I have already set these options in my Fortran and C++ projects.
The .PDB files are generated in their .\x64\debug\ folders, I have already added these folders in Inspector's project properity settings.
About the command line, do you mean that I only need to replace the original command by 'inspxe-cl -c mi3 -- fem.exe'? OK, I will test it right now.
Thanks,
Tang Laoya
- Mark as New
- Bookmark
- Subscribe
- Mute
- Subscribe to RSS Feed
- Permalink
- Report Inappropriate Content
You can do such as - "'inspxe-cl -c mi3 -search-dir all:rp=dir-of-bin -search-dir all:rp=dir-of-pdb -search-dir all:rp=dir-of-src -- fem.exe". So you don't need to re-resolve the result, I mentioned in 1st reply.
- Mark as New
- Bookmark
- Subscribe
- Mute
- Subscribe to RSS Feed
- Permalink
- Report Inappropriate Content
- Mark as New
- Bookmark
- Subscribe
- Mute
- Subscribe to RSS Feed
- Permalink
- Report Inappropriate Content
Dear Peter Wang,
As you suggested, I recreated the project by gathering all Fortran code into a folder and built the project. The .PDB files are all in .|Debug folder. I run later inspector 2016 by the following command:
inspxe-cl -c mi3 -search-dir all:rp=.\ -search-dir all:rp=.\ -search-dir all:rp=..\ -- fem.exe
However, the result is still the same, is there anything I missed?
Thanks,
Tang Laoya
- Mark as New
- Bookmark
- Subscribe
- Mute
- Subscribe to RSS Feed
- Permalink
- Report Inappropriate Content
Oh...I don't know why the tool reported there was no directory exists. Additional things are:
1. You don't need to specify all sub-directories, if they are under one parent folder - just use parent directory because "r" means recursive search.
2. I found you might have *multiple* versions of fem application, ensure if running fem.exe matches fem.pdb. Don't search other directories which include old fem.exe and fem.pdb.
3. If problem persists, you can do "re-resolve" in command line. Note put exe/pdb/src under one parent directory then use "search-dir"
Send me private message with result, exe, pdb, problematic src, then I can know more.
- Mark as New
- Bookmark
- Subscribe
- Mute
- Subscribe to RSS Feed
- Permalink
- Report Inappropriate Content
Dear Peter Wang,
Thank you very much for your kindly reply. I have only a version fem and I put all exe and pdb files in debug folder and source files in their parent folder. The inspector will run more than 10 hours to get a collected result.
How can I send you files by private message (files are very large, more than 200 MB)? Can you get location of problem only by the fem.exe and fem.pdb?
Thanks,
Tang Laoya
- Mark as New
- Bookmark
- Subscribe
- Mute
- Subscribe to RSS Feed
- Permalink
- Report Inappropriate Content
- Mark as New
- Bookmark
- Subscribe
- Mute
- Subscribe to RSS Feed
- Permalink
- Report Inappropriate Content
Just click on "Send Author A Message" of any my post to write message and attach files. If Files are great than 20MB, that could be a problem. Lets postpone to do this...
P1 was located at kernel source, you can use option "-knob detect-resource-leaks=false" to collect; don't collect such data.
P6&P7 were located in ntdll.dll, you can add ignore (filter) these problem by using option "-module-filter-mode=include -module-filter=fem.exe"
Other problem reports are memory leaks in fem.exe, allocation site at function mkl_serv_allocate() which has no source, I think.
You might go MKL forum to ask why you had leak issue.
--------------------------------------------------------------------------------------------------------------------------
C:\Users\zwang14\Desktop\Test>inspxe-cl -R problem -r r003mi3
P1: Error: Kernel resource leak: Not fixed
P1.73: Error: Kernel resource leak: Not fixed
f:\dd\vctools\crt\crtw32\startup\crt0dat.c(954): Error X73: Critical section c
reation site: Function initterm: Module E:\Users\tang\tang\logging\fenglw\loggin
g\fem all\fem_memtest\fem\x64\Debug\fem.exe
P2: Error: Memory leak: New
P2.70: Error: Memory leak: 13225040 Bytes: New
fem.exe!0x00000000012C1728: Error X70: Allocation site: Function mkl_serv_allo
cate: Module E:\Users\tang\tang\logging\fenglw\logging\fem all\fem_memtest\fem\x
64\Debug\fem.exe
P3: Error: Memory leak: New
P3.71: Error: Memory leak: 1776320 Bytes: New
fem.exe!0x00000000012C1ACE: Error X71: Allocation site: Function mkl_serv_allo
cate: Module E:\Users\tang\tang\logging\fenglw\logging\fem all\fem_memtest\fem\x
64\Debug\fem.exe
P4: Error: Memory leak: New
P4.72: Error: Memory leak: 896 Bytes: New
fem.exe!0x00000000012C2374: Error X72: Allocation site: Function [Unknown]: Mo
dule E:\Users\tang\tang\logging\fenglw\logging\fem all\fem_memtest\fem\x64\Debug
\fem.exe
P5: Error: Memory leak: New
P5.60: Error: Memory leak: 1568 Bytes: New
fem.exe!0x00000000012C2913: Error X60: Allocation site: Function mkl_serv_mall
oc: Module E:\Users\tang\tang\logging\fenglw\logging\fem all\fem_memtest\fem\x64
\Debug\fem.exe
P6: Error: Invalid memory access: New
P6.23: Error: Invalid memory access: New
ntdll.dll!0x000000000004AC04: Error X23: Read: Function RtlDeNormalizeProcessP
arams: Module C:\Windows\SYSTEM32\ntdll.dll
P7: Error: Invalid memory access: New
P7.24: Error: Invalid memory access: New
ntdll.dll!0x000000000004AC04: Error X24: Write: Function RtlDeNormalizeProcess
Params: Module C:\Windows\SYSTEM32\ntdll.dll
- Mark as New
- Bookmark
- Subscribe
- Mute
- Subscribe to RSS Feed
- Permalink
- Report Inappropriate Content
Dear Peter Wang,
Thank you very much for your kindly reply. Do you mean that the memory leakage could be from MKL libraries instead of my fem source code? OK, I will send the message to MKL forum.
Thanks,
Tang Laoya
- Mark as New
- Bookmark
- Subscribe
- Mute
- Subscribe to RSS Feed
- Permalink
- Report Inappropriate Content
Yeah, based on call stack, calling sequence was -
Description Source Function Module Object Size Offset
Allocation site fem.exe:0x00000000012C1ACE mkl_serv_allocate fem.exe 21248
>fem.exe!mkl_serv_allocate
fem.exe!mkl_blas_mc3_dgemm_get_bufs
fem.exe!mkl_blas_mc3_xdgemm_par
fem.exe!mkl_blas_mc3_xdgemm
fem.exe!mkl_blas_dgemm_omp_driver_v1
- Mark as New
- Bookmark
- Subscribe
- Mute
- Subscribe to RSS Feed
- Permalink
- Report Inappropriate Content
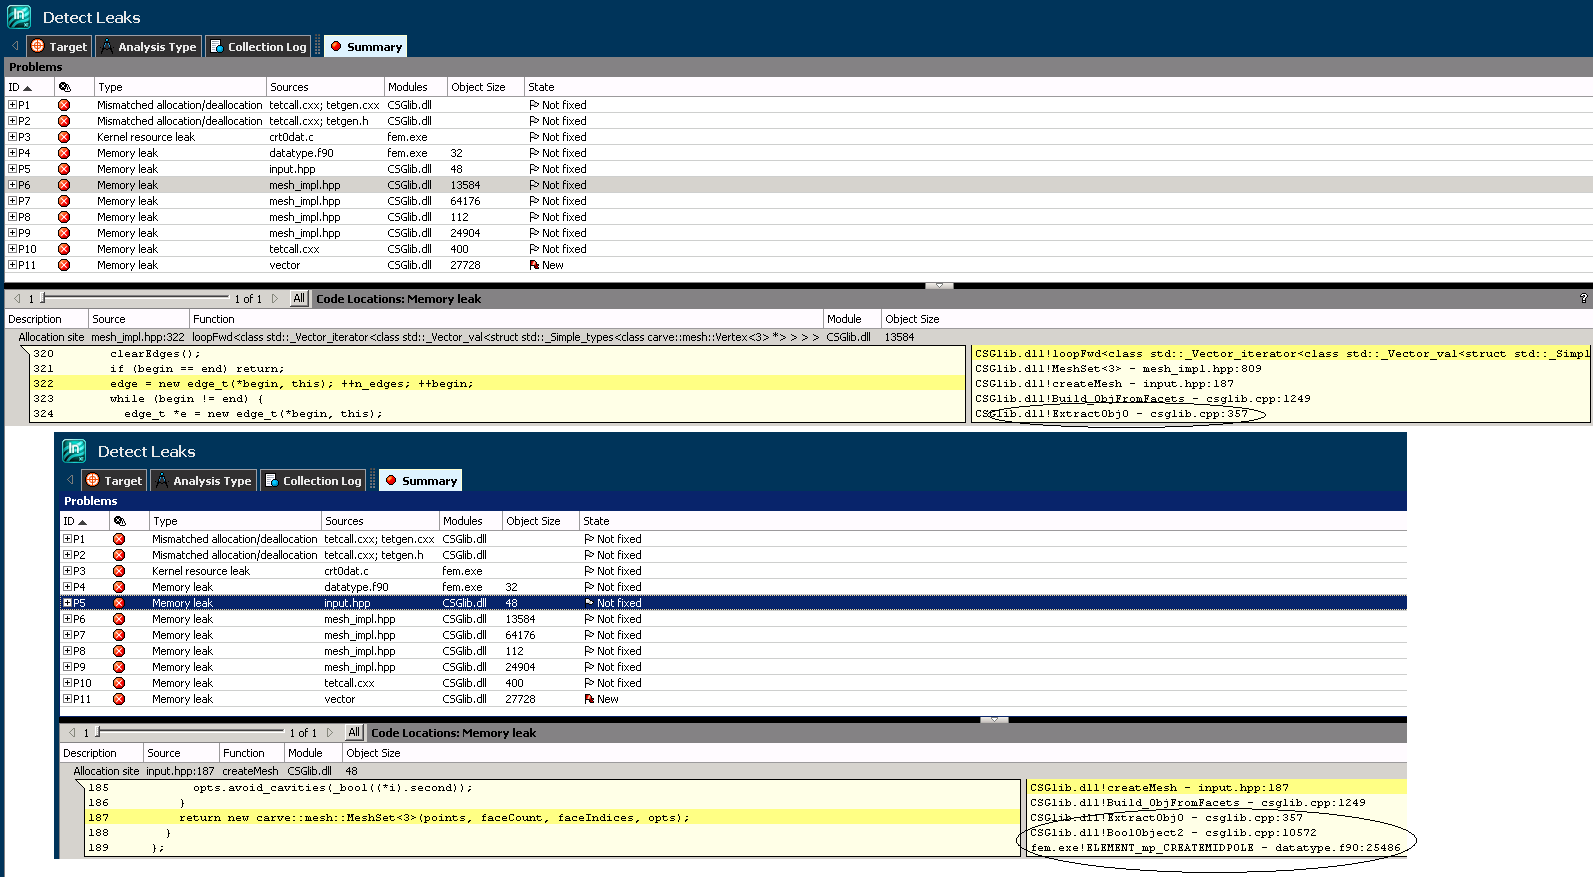
Dear Peter Wang,
I have another question about call stack display. there are several memory leaks in my code, they are shown in the attached figure. However, from the message I can't find the full calling stack, for example, they are both related to line 357 of csglib.cpp, but P5 shows the deeper stack: line 25486 of datatype.f90, but P6 doesn't show the deeper stack.
Is there any settings help me to show the full calling stack?
Thanks,
Tang Laoya
- Mark as New
- Bookmark
- Subscribe
- Mute
- Subscribe to RSS Feed
- Permalink
- Report Inappropriate Content
Hi Tang Laoya,
That is the problem on GUI. The report only displays top 5 from call stack because of size of sub-window.
You might use command line to display full contents of call stack, like:
> inspxe-cl -R problems -r r001mi3 -verbose
Regards, Peter
- Mark as New
- Bookmark
- Subscribe
- Mute
- Subscribe to RSS Feed
- Permalink
- Report Inappropriate Content
Dear Peter Wang,
Thank you very much for your kindly reply. I used the command you suggested, but it display the following error message:
E:\Users\tang\tang\memorytest>inspxe-cl -R problems -r r001mi3 -verbose
Error: Result directory E:\Users\tang\tang\memorytest\r001mi3 is not found or empty. Suggestion: Specify valid path.
Even I created the folder r001mi3 folder in E:\Users\tang\tang\memorytest\
I have reported this problem before.
Thanks,
Tang Laoya
- Mark as New
- Bookmark
- Subscribe
- Mute
- Subscribe to RSS Feed
- Permalink
- Report Inappropriate Content
I see. I should use the result got from GUI instead collecting results by that command.
Thanks,
Tang Laoya
- Subscribe to RSS Feed
- Mark Topic as New
- Mark Topic as Read
- Float this Topic for Current User
- Bookmark
- Subscribe
- Printer Friendly Page