- Mark as New
- Bookmark
- Subscribe
- Mute
- Subscribe to RSS Feed
- Permalink
- Report Inappropriate Content
Hello,
I've downloaded and install the oneAPI base toolkits and using vtune 2022.2.0
I use 5.15.39(with CONFIG_DRM_I915_LOW_LEVEL_TRACEPOINTS=y)
sudo ./prepare-debugfs.sh
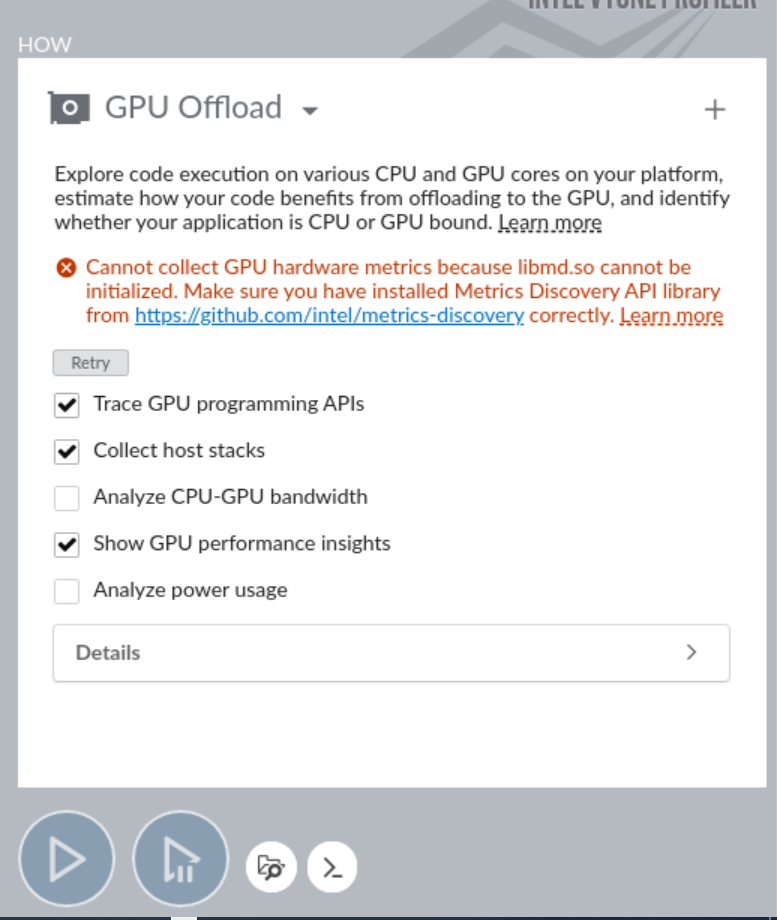
and when open vtune (even with preload sign) when select GPU compute/media hotspot, The Error Occurs: Cannot collect GPU hardware metrics because libmd.so cannot be initialized. Make sure you have installed Metrics Discovery API library from https://github.com/intel/metrics-discovery correctly. Learn more
I checked amplxe-runss --context-value-list
Driver does not support the 0x4680 PCI ID.
targetOS: Linux
OS: Linux
OSBuildNumber: 39
OSBitness: 64
RootPrivileges: false
isPtraceScopeLimited: false
isCATSupportedByCPU: true
isL3CATAvailable: false
isL2CATAvailable: true
L2CATDetails: COS=8;ways=10
isL3MonitoringSupportedByCPU: false
isTSXAvailable: false
isPTAvailable: true
isHTEnabled: true
fpgaOnBoard: None
omniPathOnBoard: None
genArchOnBoard: 10
pciClassParts:
tidValuesForIO:
populatedIoParts:
populatedIoUnits:
populatedTidValuesForIO:
isSGXAvailable: false
LinuxRelease: 5.15.39
is3DXPPresent: false
is3DXP2LMMode: false
is3DXPAppDirectMode: false
IsNUMANodeWithoutCPUsPresent: false
Hypervisor: None
PerfmonVersion: 5
isMaxDRAMBandwidthMeasurementSupported: true
preferedGpuAdapter: 0:0:2.0
gpuAdapterNameList: 0:0:2.0|AlderLake-S GT1;
gpuAdapterTileNameList: 0:0:2.0|AlderLake-S GT1|0,;
gpuOpenCLDeviceOrder: bdf
isEHFIAvailable: true
isPtraceAvailable: true
areGpuHardwareMetricsAvailableList: 0:0:2.0|InitializationError;
gpuPlatformIndexList: 0:0:2.0|0;
i915Status: KernelNotPatched
isFtraceAvailable: yes
isMdfEtwAvailable: false
isCSwitchAvailable: yes
isGpuBusynessAvailable: yes
isGpuWaitAvailable: yes
isFunctionTracingAvailable: yes
isIowaitTracingAvailable: yes
isVSyncAvailable: yes
HypervisorType: None
isDeviceOrCredentialGuardEnabled: false
isSEPDriverAvailable: true
SEPDriverVersion: 5.33
isPAXDriverLoaded: true
PAXDriverVersion: 1.0
platformType: 145
CPU_NAME: Intel(R) microarchitecture code named Alderlake-S
PMU: alderlake
availablePmuTypes: bigcore,smallcore,cbo,ncu,imc,power
referenceFrequency: 3200000000
isPStateAvailable: true
isVTSSPPDriverAvailable: true
isNMIWatchDogTimerRunning: true
LinuxPerfCredentials: Restricted
LinuxPerfCapabilities: NotAvailable
LinuxPerfStackCapabilities: NotAvailable
areKernelPtrsRestricted: yes
isPerfPCIeMappingAvailable: false
isAOCLAvailable: true
isTPSSAvailable: true
isPytraceAvailable: true
isGENDebugInfoAvailableList: 0:0:2.0|true;
isGTPinCollectionAvailableList: 0:0:2.0|true;
forceShowInlines: false
isEnergyCollectionSupported: true
isSocwatchDriverLoaded: true
isCPUSupportedBySocwatch: false
isCpuThrottlingAvailable: false
isIPMWatchReady: false
osCountersCollectorAvailability: dstatNotFound
l0LoaderStatus: InitializationError
l0DevicesAvailable: false
l0VPUDevicesAvailable: false
l0GPUDevicesAvailable: false
Please let me know what additional info you need.
Thanks!
- Mark as New
- Bookmark
- Subscribe
- Mute
- Subscribe to RSS Feed
- Permalink
- Report Inappropriate Content
Hi,
Good day to you.
We contacted you privately and shared some information via mail. There are some issues with Alder lake machines, so the workaround is to try on a different machine.
If this resolves your issue, make sure to accept this as a solution. This would help others with similar issues.
Please let me know if we can go ahead and close this case?
Thanks and Regards,
Jaideep
Link Copied
- Mark as New
- Bookmark
- Subscribe
- Mute
- Subscribe to RSS Feed
- Permalink
- Report Inappropriate Content
Hi,
Thank you for posting in Intel Communities.
Can you please answer the following questions:
- Can you please tell me the name of the operating system and processor details you are using? (If Linux, please specify the distribution like Centos7,8, Ubuntu18,20, etc.)
- Can you please upgrade your Vtune profiler to 2022.3 and try the same?
- Please attach self-checker logs by running the below command.
<Vtune_installation_directory\latest\bin64\vtune-self-checker.bat> for windows.

<Vtune_installation_directory\latest\bin64\vtune-self-checker.sh> for linux.- If possible, attach screenshots. so we can reproduce your issue from our end.
Thanks,
Jaideep
- Mark as New
- Bookmark
- Subscribe
- Mute
- Subscribe to RSS Feed
- Permalink
- Report Inappropriate Content
Hi,
Thanks for your reply!
- I'm using Ubuntu 22.04 LTS (GNU/Linux 5.15.39 x86_64) on 12th Gen Intel(R) Core(TM) i9-12900K
- Yes I've tried to upgrade it to 2022.3 with a standalone version but it still does not work. mentioned that I've installed the metric-discovery following the README instructions.
- blow is the log of self-checker:
Intel(R) VTune(TM) Profiler Self Check Utility
Copyright (C) 2009 Intel Corporation. All rights reserved.
Build Number: 624050
HW event-based analysis (counting mode) (Intel driver)
Example of analysis types: Performance Snapshot
Collection: Ok
vtune: Warning: Cannot collect GPU hardware metrics because libmd.so cannot be initialized. Make sure you have installed Metrics Discovery API library from https://github.com/intel/metrics-discovery correctly. See Error Message: Cannot Collect GPU Hardware Metrics help topic for more details.
Finalization: Ok...
vtune: Warning: Cannot collect GPU hardware metrics because libmd.so cannot be initialized. Make sure you have installed Metrics Discovery API library from https://github.com/intel/metrics-discovery correctly. See Error Message: Cannot Collect GPU Hardware Metrics help topic for more details.
Report: Ok
Instrumentation based analysis check
Example of analysis types: Hotspots and Threading with user-mode sampling
Collection: Ok
Finalization: Ok...
Report: Ok
HW event-based analysis check (Intel driver)
Example of analysis types: Hotspots with HW event-based sampling, HPC Performance Characterization, etc.
Collection: Ok
vtune: Warning: To enable hardware event-based sampling, VTune Profiler has disabled the NMI watchdog timer. The watchdog timer will be re-enabled after collection completes.
Finalization: Ok...
vtune: Warning: Cannot locate debugging information for the Linux kernel. Source-level analysis will not be possible. Function-level analysis will be limited to kernel symbol tables. See the Enabling Linux Kernel Analysis topic in the product online help for instructions.
Report: Ok
HW event-based analysis check (Intel driver)
Example of analysis types: Microarchitecture Exploration
Collection: Ok
vtune: Warning: To enable hardware event-based sampling, VTune Profiler has disabled the NMI watchdog timer. The watchdog timer will be re-enabled after collection completes.
Finalization: Ok...
vtune: Warning: Cannot read load addresses of sections from `/sys/module/r8169/sections'. This may affect the correctness of symbol resolution for `r8169'. Make sure this directory exists and all files in this directory have read permissions.
vtune: Warning: Cannot locate debugging information for the Linux kernel. Source-level analysis will not be possible. Function-level analysis will be limited to kernel symbol tables. See the Enabling Linux Kernel Analysis topic in the product online help for instructions.
Report: Ok
HW event-based analysis with uncore events (Intel driver)
Example of analysis types: Memory Access
Collection: Ok
vtune: Warning: To enable hardware event-based sampling, VTune Profiler has disabled the NMI watchdog timer. The watchdog timer will be re-enabled after collection completes.
Finalization: Ok...
vtune: Warning: Cannot read load addresses of sections from `/sys/module/r8169/sections'. This may affect the correctness of symbol resolution for `r8169'. Make sure this directory exists and all files in this directory have read permissions.
vtune: Warning: Cannot read load addresses of sections from `/sys/module/kvm/sections'. This may affect the correctness of symbol resolution for `kvm'. Make sure this directory exists and all files in this directory have read permissions.
vtune: Warning: Cannot locate debugging information for the Linux kernel. Source-level analysis will not be possible. Function-level analysis will be limited to kernel symbol tables. See the Enabling Linux Kernel Analysis topic in the product online help for instructions.
Report: Ok
HW event-based analysis with stacks (Intel driver)
Example of analysis types: Hotspots with HW event-based sampling and call stacks
Collection: Ok
vtune: Warning: To enable hardware event-based sampling, VTune Profiler has disabled the NMI watchdog timer. The watchdog timer will be re-enabled after collection completes.
Finalization: Ok...
vtune: Warning: Cannot locate debugging information for the Linux kernel. Source-level analysis will not be possible. Function-level analysis will be limited to kernel symbol tables. See the Enabling Linux Kernel Analysis topic in the product online help for instructions.
Report: Ok
HW event-based analysis with context switches (Intel driver)
Example of analysis types: Threading with HW event-based sampling
Collection: Ok
vtune: Warning: To enable hardware event-based sampling, VTune Profiler has disabled the NMI watchdog timer. The watchdog timer will be re-enabled after collection completes.
Finalization: Ok...
vtune: Warning: Cannot locate debugging information for the Linux kernel. Source-level analysis will not be possible. Function-level analysis will be limited to kernel symbol tables. See the Enabling Linux Kernel Analysis topic in the product online help for instructions.
Report: Ok
Checking DPC++ application as prerequisite for GPU analyses: Ok
GPU HW event-based analysis with runtime tracing
Example of analysis types: GPU Compute/Media Hotspots (characterization mode)
Collection: Fail
vtune: Error: Cannot collect GPU hardware metrics because libmd.so cannot be initialized. Make sure you have installed Metrics Discovery API library from https://github.com/intel/metrics-discovery correctly. See Error Message: Cannot Collect GPU Hardware Metrics help topic for more details.
GPU software event-based analysis with runtime tracing
Example of analysis types: GPU Compute/Media Hotspots (source analysis mode)
Collection: Ok
vtune: Warning: To enable hardware event-based sampling, VTune Profiler has disabled the NMI watchdog timer. The watchdog timer will be re-enabled after collection completes.
Finalization: Ok...
vtune: Warning: Cannot locate debugging information for the Linux kernel. Source-level analysis will not be possible. Function-level analysis will be limited to kernel symbol tables. See the Enabling Linux Kernel Analysis topic in the product online help for instructions.
vtune: Warning: Cannot read load addresses of sections from `/sys/module/i915/sections'. This may affect the correctness of symbol resolution for `i915'. Make sure this directory exists and all files in this directory have read permissions.
Report: Ok
The check observed a product failure on your system.
Review errors in the output above to fix a problem or contact Intel technical support.
The system is ready for the following analyses:
* Performance Snapshot
* Hotspots and Threading with user-mode sampling
* Hotspots with HW event-based sampling, HPC Performance Characterization, etc.
* Microarchitecture Exploration
* Memory Access
* Hotspots with HW event-based sampling and call stacks
* Threading with HW event-based sampling
* GPU software event-based analysis with runtime tracing
The following analyses have failed on the system:
* GPU Compute/Media Hotspots (characterization mode)
Log location: /tmp/vtune-tmp-jia3xu/self-checker-2022.08.12_10.00.39/log.txt
- blew are the screenshots.
- the log produced by the self-checker is uploaded in the attachment.
thanks for your help and let me know if any additional info is needed.
- Mark as New
- Bookmark
- Subscribe
- Mute
- Subscribe to RSS Feed
- Permalink
- Report Inappropriate Content
Hi,
We were able to reproduce your issue from our end, and we are working on this internally. We will get back to you with an update.
Can you please try on other machines (other than Alder Lake)?
Thanks,
Jaideep
- Mark as New
- Bookmark
- Subscribe
- Mute
- Subscribe to RSS Feed
- Permalink
- Report Inappropriate Content
Hi,
I've tried on a tigerlake (1135G7) on a Ubuntu 22.04 LTS (GNU/Linux 5.13.0-28-generic x86_64)
and the GPU offload works fine.
and thanks for your work on alder lake and waiting for your reply.
Thanks.
- Mark as New
- Bookmark
- Subscribe
- Mute
- Subscribe to RSS Feed
- Permalink
- Report Inappropriate Content
Hi,
Good day to you.
We contacted you privately and shared some information via mail. There are some issues with Alder lake machines, so the workaround is to try on a different machine.
If this resolves your issue, make sure to accept this as a solution. This would help others with similar issues.
Please let me know if we can go ahead and close this case?
Thanks and Regards,
Jaideep
- Mark as New
- Bookmark
- Subscribe
- Mute
- Subscribe to RSS Feed
- Permalink
- Report Inappropriate Content
Hello There,
Just wanted to check if there is a solution available to run vtune on Alder lake machines? If you might have some solution/workaround in the meantime, please do share.
Thanks,
Jayabalaji
- Mark as New
- Bookmark
- Subscribe
- Mute
- Subscribe to RSS Feed
- Permalink
- Report Inappropriate Content
Hi,
Thanks for accepting our solution. If you need any additional information, please post a new question as this thread will no longer be monitored by Intel.
Thanks,
Jaideep
- Subscribe to RSS Feed
- Mark Topic as New
- Mark Topic as Read
- Float this Topic for Current User
- Bookmark
- Subscribe
- Printer Friendly Page

