- Mark as New
- Bookmark
- Subscribe
- Mute
- Subscribe to RSS Feed
- Permalink
- Report Inappropriate Content
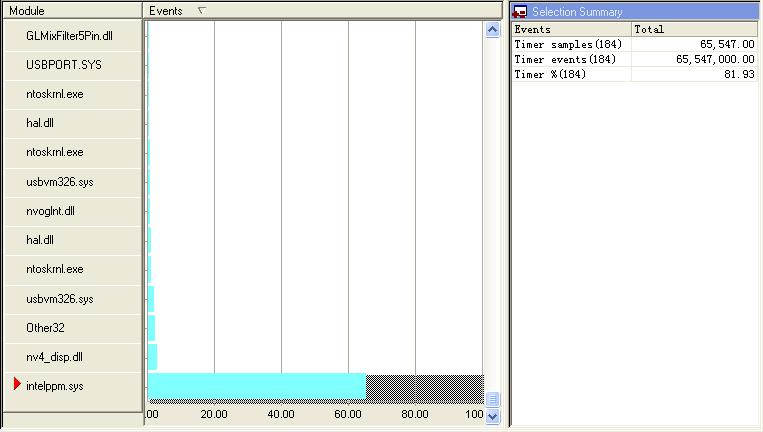
hello everyone, I am a very newer to use this tool. I did samplingby countingtimer event, and got the results and the histograms. However,I found they are not the same.The result summary shows that
intelppm.sys timer %(184) 81.93%
In the module histogram, the column of intelppm.sys has less than 70% length,
I atteched the screen capture.
Why?
Thanks everyone.
Link Copied
1 Reply
- Mark as New
- Bookmark
- Subscribe
- Mute
- Subscribe to RSS Feed
- Permalink
- Report Inappropriate Content
This seems like a bug. Please file a Premier Issue to get this issue followed up and resolved. Sorry for the inconvenience.
Reply
Topic Options
- Subscribe to RSS Feed
- Mark Topic as New
- Mark Topic as Read
- Float this Topic for Current User
- Bookmark
- Subscribe
- Printer Friendly Page