- 신규로 표시
- 북마크
- 구독
- 소거
- RSS 피드 구독
- 강조
- 인쇄
- 부적절한 컨텐트 신고
Hi,
I'm working with Altera streaming 1024 points FFT core (fft v13). I want to get spectrum but i'm enable to extract frequency information from outputs. Anybody can help me please! Thanks Regards,링크가 복사됨
5 응답
- 신규로 표시
- 북마크
- 구독
- 소거
- RSS 피드 구독
- 강조
- 인쇄
- 부적절한 컨텐트 신고
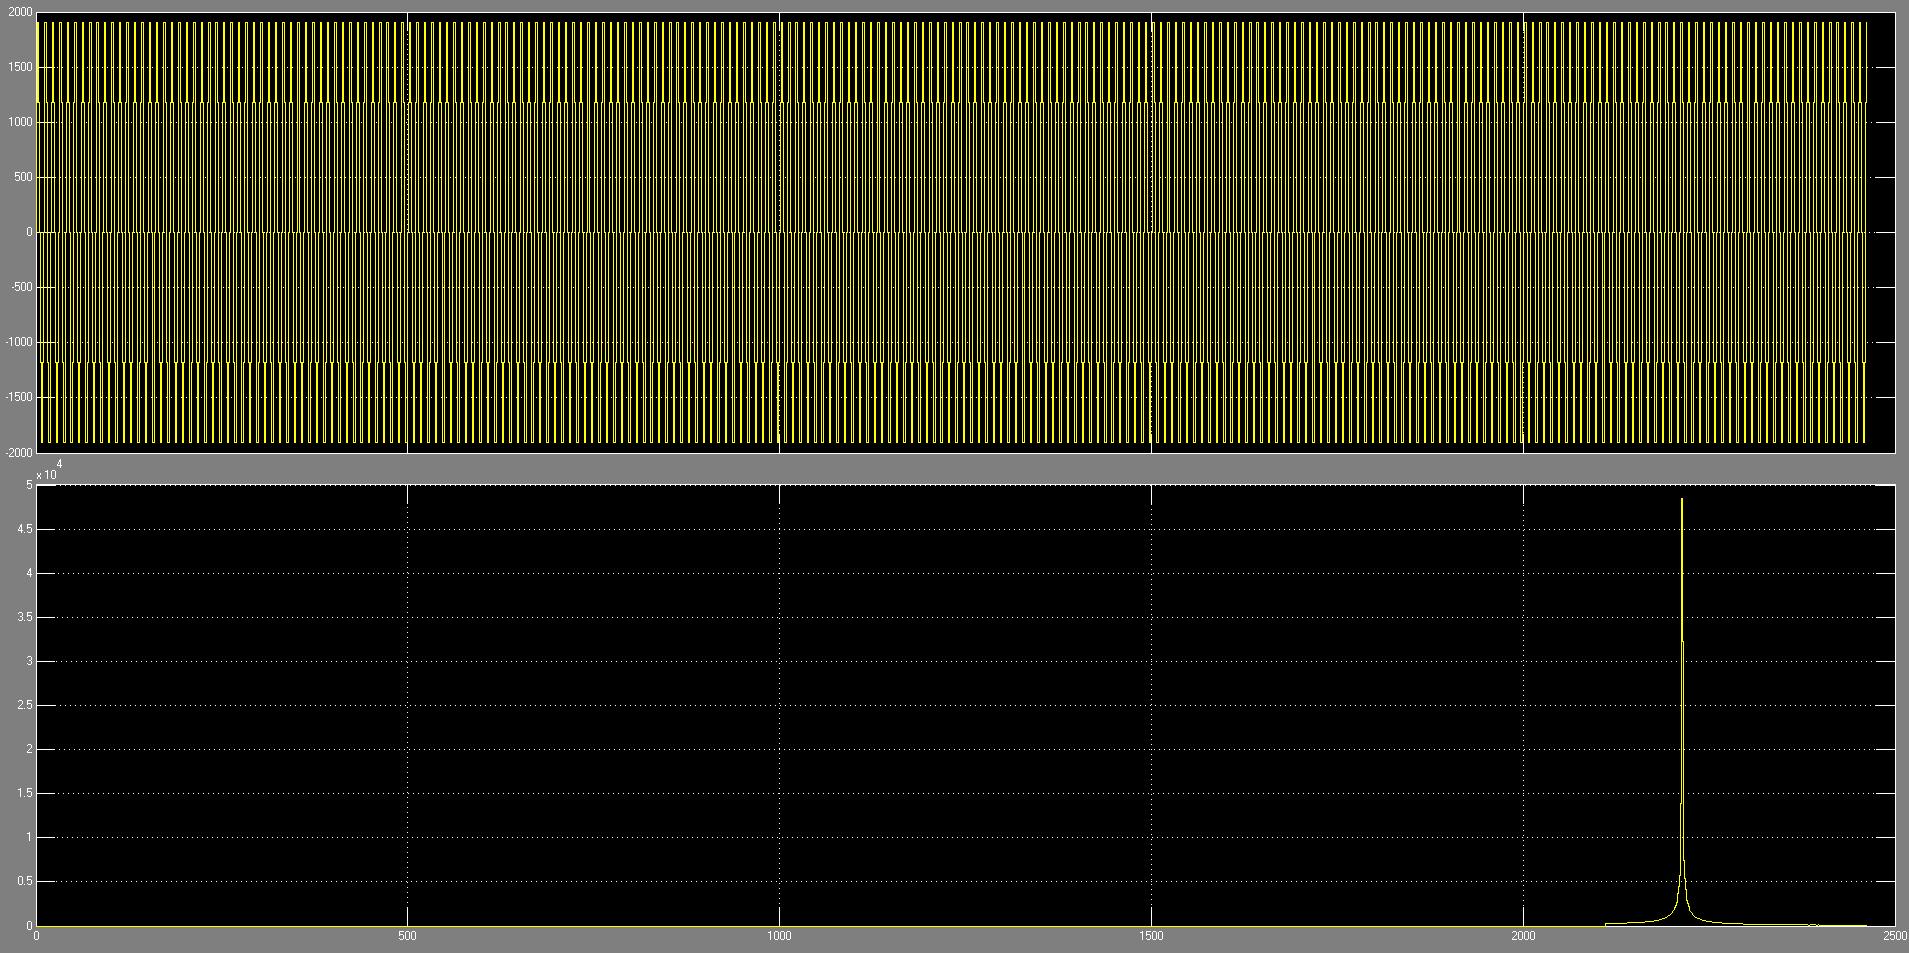
You're not very clear on what you're doing. My guess is you're using DSP Builder and the FFT Megacore as that screenshot looks like a Simulink scope. If you want useful answers you need to give much more information so that people don't have to guess.
You've connected your input data and output data to a scope, which always shows a signal plotted against time. To get a graph of the frequency you need to save that data to a variable using a "To Workspace" block. Then you can use the MATLAB command "plot" the points against any values you like. You may be able to do it directly using the vector scope block as well.- 신규로 표시
- 북마크
- 구독
- 소거
- RSS 피드 구독
- 강조
- 인쇄
- 부적절한 컨텐트 신고
Hi dabuk,
Thank you for your reply. I will do it. Sorry, I am a beginner in DSP. I will be more clear. I have to implement an algorithm in fpga which allows me to make the time-frequency analysis. I'm obliged to extract input signal frequency??- 신규로 표시
- 북마크
- 구독
- 소거
- RSS 피드 구독
- 강조
- 인쇄
- 부적절한 컨텐트 신고
I'm no expert either.
I guess you will have to create a component that reads in the values of the FFT and then finds the maximum magnitude. You can then multiply the time-step of the maximum value by the frequency per bin and you will have the frequency of the largest component. To do this you will have to write some HDL or use a tool like DSP Builder.- 신규로 표시
- 북마크
- 구독
- 소거
- RSS 피드 구독
- 강조
- 인쇄
- 부적절한 컨텐트 신고
I'm using DSP Builder. I will try it and i'll tell you the result.
Regards,