- Mark as New
- Bookmark
- Subscribe
- Mute
- Subscribe to RSS Feed
- Permalink
- Report Inappropriate Content
Hello everyone,
I would like to trace program execution on the Nios II. One way - to buy Lauterbach - not interesting. Second way - use SignalTap II and .objdump file - pretty well, but still. And now I see in the Level 3 of JTAG Debug window "On-chip Trace". I didn't find any information, except that I can choose the size of OCI Onchip Trace. But I don't understand how to manage with it: start/stop/read. A little info is in manual https://www.intel.com/content/dam/www/programmable/us/en/pdfs/literature/hb/nios2/n2cpu-nii5v1gen2.pdf
But it tells only about the abilities, not about instruments or ways.
- Tags:
- Nios® II Processor
Link Copied
- Mark as New
- Bookmark
- Subscribe
- Mute
- Subscribe to RSS Feed
- Permalink
- Report Inappropriate Content
- Mark as New
- Bookmark
- Subscribe
- Mute
- Subscribe to RSS Feed
- Permalink
- Report Inappropriate Content
Dear Embedded_guy,
Thank you for response, but the first link is only describe the ability, but has no comments, for example, how to get whole data from JTAG Debug level 3 onchip buffer
As for the second link - yes, in 2009 this feature were available, I even checked Nios II 10.0 IDE to test it - and it worked! But the same feature for Nios II gen2 or for Nios II classic in Q13.1 and later is absent. Even profiling doesn't work properly
Regards,
Daniil
- Mark as New
- Bookmark
- Subscribe
- Mute
- Subscribe to RSS Feed
- Permalink
- Report Inappropriate Content
- Mark as New
- Bookmark
- Subscribe
- Mute
- Subscribe to RSS Feed
- Permalink
- Report Inappropriate Content
Dear Embedded_guy,
Thank you for your answer. I watched the video and it is just about regular software debug, while I'm asking
about Tracing mode and profiling the code. I understand how to use Debug, but sometimes it is not enough.
I found trace working in Nios II EDS with Quartus 10.0, but in fresh Nios SBT there is nothing about it.
I can choose on of five levels of debug, anf the 3rd one tells, that I can use On-chip trace.
I also don't understand your phrase "The debugger level shows the level of targeted components in the debugger."
By the level of targeted components - what do you mean?
Also thank you for your note, I've checked flags for compilation, they are identical
- Mark as New
- Bookmark
- Subscribe
- Mute
- Subscribe to RSS Feed
- Permalink
- Report Inappropriate Content
- Mark as New
- Bookmark
- Subscribe
- Mute
- Subscribe to RSS Feed
- Permalink
- Report Inappropriate Content
It is interesting,
Sorry for interrupting, do you mean that I cannot find the debug level in the new GUI? I am not sure but you still can use the shell commands.
Correct?
- Mark as New
- Bookmark
- Subscribe
- Mute
- Subscribe to RSS Feed
- Permalink
- Report Inappropriate Content
Dear ABola2,
Let us first of all determine what the debug level means.
In my questions debug level is about hardware part of the project, which I can choose in Qsys/Platform Designer
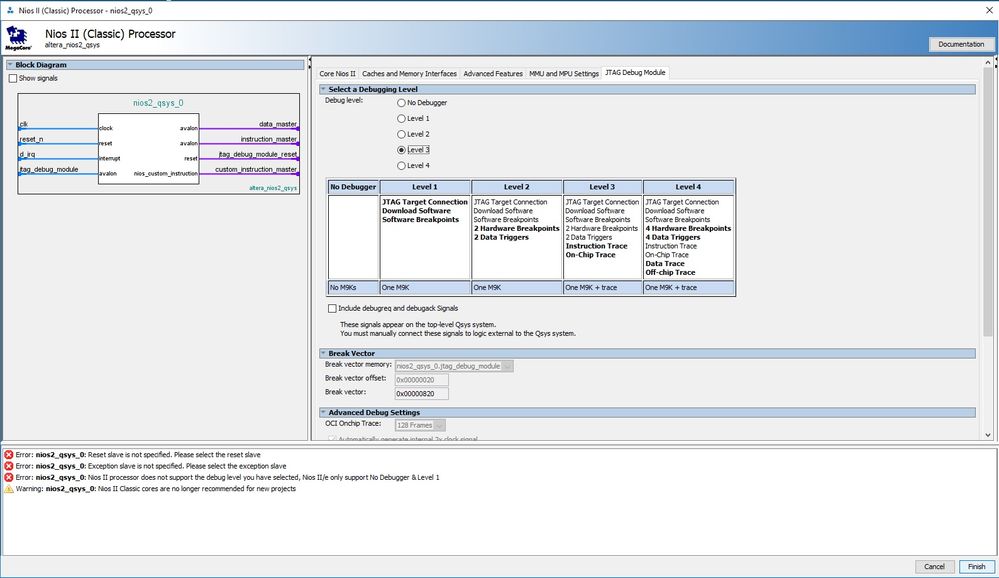
I just use "level" because of the Nios II classic form of choice (pic.1). Btw sorry for 5 levels, there are actually four,
I just included the absent of debug as level.
Pic.1 Nios II classic JTAG Debug settings
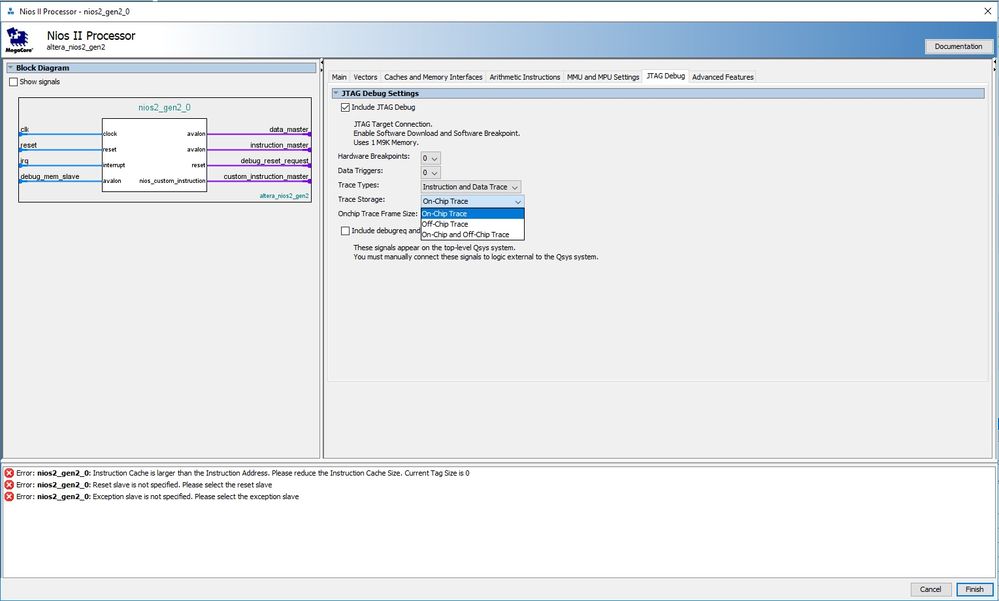
As for the Nios II gen2 I just can turn JTAG Debug on and choose what
functions of Debug I need. For example, I can turn on the Onchip Trace (pic.2)
Pic.2 Nios II gen 2 JTAG Debug settings
So I turn this on, and then... I'm not sure if there is any instrument
for the new Quartus which support Tracing mode, or even profiling mode
- Mark as New
- Bookmark
- Subscribe
- Mute
- Subscribe to RSS Feed
- Permalink
- Report Inappropriate Content
- Mark as New
- Bookmark
- Subscribe
- Mute
- Subscribe to RSS Feed
- Permalink
- Report Inappropriate Content
Dear Embedded_guy
Thank you for this information, but I guess you don't understand my question.
I got you, by Nios II GUI you mean Platform Designer IP customization, by debug level you mean hardware level.
Now my question is - when I choose with new GUI:
Hardware Breakpoints=0
Data triggers=0
Trace Types= Instruction and Data Trace
Trace storage= On-chip Trace
On-Chip Trace Frame Size= 128
Where can I get this Trace information? What software should I use during the trace?
- Mark as New
- Bookmark
- Subscribe
- Mute
- Subscribe to RSS Feed
- Permalink
- Report Inappropriate Content
- Mark as New
- Bookmark
- Subscribe
- Mute
- Subscribe to RSS Feed
- Permalink
- Report Inappropriate Content
Yes, but saying in advance - by using SignalTap I do not need even Debug to be turned on, so the settings for trace is for something another.
I used this manual: https://www.intel.com/content/dam/www/programmable/us/en/pdfs/literature/an/an446.pdf
But since it is only from 2011 I haven't found any information if it is nios trace replacement, and this analysis is not very good for tracing
- Mark as New
- Bookmark
- Subscribe
- Mute
- Subscribe to RSS Feed
- Permalink
- Report Inappropriate Content
- Mark as New
- Bookmark
- Subscribe
- Mute
- Subscribe to RSS Feed
- Permalink
- Report Inappropriate Content
Dear Embedded_guy,
About debug level in Eclipse. I didn't find any document which describes this little setting. Anyway, by turning on the same level of debug in project settings I now can profile my code, but still no trace is still avaliable from Eclipse, or I just didn't find how to turn it on yet.
-The first link is about SoC systems with ARM, so it doesn't helpful for me since i'm about Nios
-The second link is better, but, unfortunately, it is about Nios II, not Nios II gen2, moreover, it is dated as December 2009... Are you sure that everythinf is the same? (spoiler - no)
-The third link describes OFFCHIP trace, while my question is about ONCHIP trace
-The fourth link is about software for using of the third's link OFFCHIP tracing
Unfortunately your answers doesn't help at all, so I don't know if it is me asking too bad or support-team don't know what the right answer is.
- Mark as New
- Bookmark
- Subscribe
- Mute
- Subscribe to RSS Feed
- Permalink
- Report Inappropriate Content
- Mark as New
- Bookmark
- Subscribe
- Mute
- Subscribe to RSS Feed
- Permalink
- Report Inappropriate Content
Dear Embedded_guy,
While Q18 is already released, I'm not quite sure that this document is still useful (December 2009??). Let me desribe what I'm talking about.
- First description of Debug I can find on the page 3-6: Nios II GDB Console and GDB Commands
This kind of debug is about GDB, no word about trace
- There is a few words about FS2 Console, which gives ability to trace(!). Here is the quote:
For more details about the Nios II-compatible version of the FS2 console, refer to the FS2-provided documentation in your Nios II installation, at \bin\fs2\doc.
Let's look inside:
There is no FS2 directory inside to check any information. There is no ability to call it from Nios2 Shell or cmd.
- SignalTap II Embedded Logic Analyzer - I can use it for tracing BUT I don't even need the debugger in Nios core for it, so it doesn't count
- Lauterbach Trace32 - this kind of debug needs extra hardware, also it is an OFF-CHIP trace
That's all. It doesn't answer my question about ON-CHIP trace abilities promised by Platform Designer.
- Mark as New
- Bookmark
- Subscribe
- Mute
- Subscribe to RSS Feed
- Permalink
- Report Inappropriate Content
- Mark as New
- Bookmark
- Subscribe
- Mute
- Subscribe to RSS Feed
- Permalink
- Report Inappropriate Content
Hi!
Is there any news related to this on chip trace?
I would like to use this feature myself in a project, but I could not figure out how to use it.
I am in the same boot as the OP: dsmirnov
Any new information would be appreciated.
Cheers!
- Subscribe to RSS Feed
- Mark Topic as New
- Mark Topic as Read
- Float this Topic for Current User
- Bookmark
- Subscribe
- Printer Friendly Page


