Arria 10 EMIF Debug GUI
Success! Subscription added.
Success! Subscription removed.
Sorry, you must verify to complete this action. Please click the verification link in your email. You may re-send via your profile.
- Intel Community
- Intel Community Knowledge Base
- Product Support Forums Knowledge Base
- FPGA Knowledge Base
- FPGA Wiki
- Arria 10 EMIF Debug GUI
Arria 10 EMIF Debug GUI
- Subscribe to RSS Feed
- Mark as New
- Mark as Read
- Bookmark
- Subscribe
- Printer Friendly Page
- Report Inappropriate Content
Arria 10 EMIF Debug GUI
About the Arria 10 External Memory Interfaces (EMIF) Debug GUI
The EMIF Debug GUI is to be used with the Arria 10 External Memory Interfaces IP and its packaged example design.
- The following assumes you are using either the DDR3, DDR4, or QDRIV EMIF example design which includes the EMIF IP as well as its respective example design.
- Steps to create the example design based on a specific EMIF configuration can be found in Altera's External Memory Interfaces Handbook.
In order to fully unlock the capabilities of the EMIF Debug GUI, you must do two things:
1. You must ensure that the EMIF Toolkit is enabled for the EMIF IP. (Steps on how to do this can be found in Altera's External Memory Interfaces Handbook.)
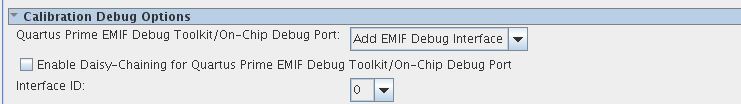
- Under the Diagnostics tab, in Quartus II EMIF Debug Toolkit/On-Chip Debug Port: select Add EMIF Debug Interface
Add EMIF Debug Interface
2. Include the following line in your project's Quartus Settings File (QSF):
set_global_assignment -name VERILOG_MACRO "ALTERA_EMIF_ENABLE_ISSP=1"
This QSF assignment will unlock all of the in-system sources and probes the EMIF Debug GUI relies on to function correctly.
Capabilities of the EMIF Debug GUI
- The Arria 10 On-Die Termination Tuning Tool helps find the optimal on-die termination settings for an External Memory Interface or EMIF.
- This includes setting the output drive strength, Dynamic ODT, Rtt Nominal, and Rtt Park settings on the memory side.
- The user can either manually change these termination settings from the original or let the tool iterate through all possible termination combinations to find the "best" setting.
- For multi rank systems interfacing with an EMIF with more than one ODT signal, the tool can also choose to turn on and off ODT signals which will make bringing up this interface easier.
- The DDR Efficiency Calculator can calculate the efficiency and effective bandwidth of the interface.
- For QDRIV, you can only do manual changes to the memory termination settings.
- This tool does not support multiple interfaces.
Storing and Opening the Arria 10 EMIF Debug GUI
Opening the EMIF Debug GUI
- Download the Arria 10 EMIF Debug GUI
- Determine where your script directory is located
- Place the EMIF Debug GUI Tcl file in the script directory
- Program your device with an image that includes the Arria 10 EMIF example design
- Open Quartus Prime's System Console
- Execute EMIF_Debug_GUI.tcl
Configurations Tab
The configurations tab will show some information on how you configured the Arria 10 EMIF IP before the generation.
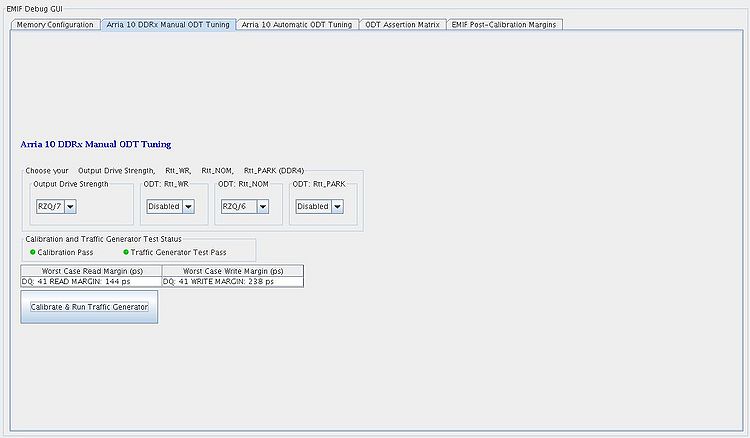
Manual ODT Selection Tab
In the Arria 10 DDRx Manual ODT Tuning Tab, you can change the memory termination and drive strength settings by setting them manually
- After making selections by the drop-down menus, you must run the Calibrate & Run Traffic Generator for the new settings to take place.
Automatic ODT Sweeping Tab
The Arria 10 Automatic ODT Tuning Tab allows you to sweep through a set of ODS and ODT combinations to quickly find a working setting based on calibration and traffic generator test status
- You can choose to sweep through all the settings by keeping the options under Lock your ODS, Rtt_WR, Rtt_NOM, Rtt_PARK set to All.
- Here you can also choose the number of traffic generator test loops you want to run under Traffic Generator Loops.
- You can lock down a certain ODS or RTT setting so the tool will sweep through a subset of the possible combinations.
e.g. If you lock ODS to RZQ/7, the sweep will not iterate over combinations with ODS = RZQ/6.
e.g. If you just want to run the traffic generator multiple times for one specific combination, lock down your ODS and RTT and choose how many TG loops to run
- After locking down your set of combinations you wish to run, click Run All ODS/RTT combinations.
- The table will show you calibration pass or fail status, as well as the ratio of TG, passes based on the number of TG loops you have chosen.
- The table will also include the worst-case Read and Write Post-Calibration margins as well as its respective DQ pin.
- From this, it will choose a "Best" ODS/RTT combination (read margin + write margin) and report it in the top table Best Setting based on R/W Margins
ODT Assertion Tab
The ODT Assertion Matrix can be useful for Multi-rank systems
- This table is similar to the ODT Activation Settings table that allows you to choose when to assert ODTs during reading and writing to specific ranks during Arria 10 EMIF IP generation (Memory Topology tab)
- You can change the ODT assertion matrix by making your On/Off selections and then clicking Set ODT table
This will re-calibrate the interface and rerun the traffic generator test with the new ODT assertion matrix.
Post-Calibration Margins Tab
The EMIF Post-Calibration Margins tab allows users to see Read and Write margin information as well as the Input and Output delays are chosen by calibration
- Clicking on Readout Margin Data will reread the DQ margin and delay information
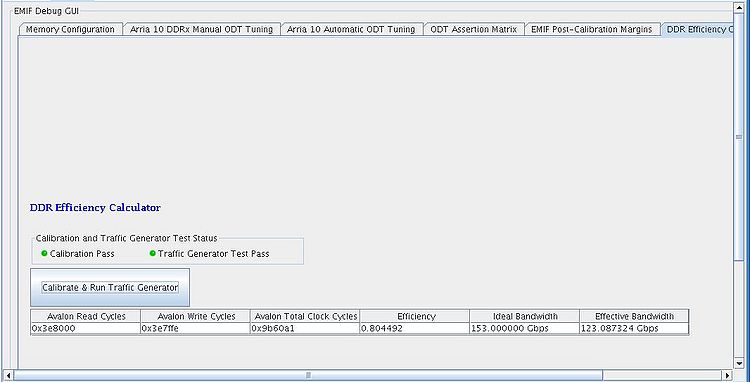
DDR Efficiency Calculator
The DDR Efficiency Calculator tab allows users to test the efficiency of their controller settings
- Before the efficiency can be calculated, several hooks and probes must be added to the top-level Verilog file of the design. This can be done automatically using the script add_efficiency_probes.tcl which can be downloaded at the bottom of this page. Place this script in the main Qsys folder of your example design. In Quartus 15.1, this will be the same as the project folder. In Quartus 16.0, this will be in the ed_synth subfolder. Then run the script by clicking Tools -> Tcl Scripts, and double-clicking on add_efficiency_probes.tcl. This script will add the necessary registers and probes to the top-level Verilog file synth/ed_synth.v. It will also modify the traffic generator test duration parameter from SHORT to MEDIUM to allow for more reliable testing.
- Once the probes have been added you can re-run the traffic generator by clicking the Calibrate & Run Traffic Generator. This will report the total write cycles, total read cycles, and total clock cycles, as well as the efficiency which is equal to (write cycles + read cycles) / (total clock cycles).
Arria 10 EMIF Debug GUI Tcl File
Community support is provided Monday to Friday. Other contact methods are available here.
Intel does not verify all solutions, including but not limited to any file transfers that may appear in this community. Accordingly, Intel disclaims all express and implied warranties, including without limitation, the implied warranties of merchantability, fitness for a particular purpose, and non-infringement, as well as any warranty arising from course of performance, course of dealing, or usage in trade.
For more complete information about compiler optimizations, see our Optimization Notice.