- Mark as New
- Bookmark
- Subscribe
- Mute
- Subscribe to RSS Feed
- Permalink
- Report Inappropriate Content
Hi,
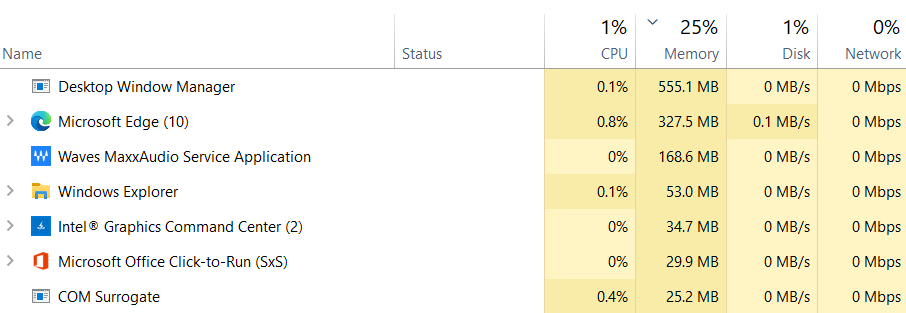
dwm.exe (Desktop-Window Manager) uses high memory with Intel Intel HD Graphics 630. This problem has been reported before:
Here's a screenshot of my dwm ram usage after 2 hours (1.6 GB):

Please, this bug is already known for 3-4 months, and I do not want to reinstall a 2019 driver...
- Mark as New
- Bookmark
- Subscribe
- Mute
- Subscribe to RSS Feed
- Permalink
- Report Inappropriate Content
It seems that everyone has posted positive results so far about beta driver 101.1121 resolving this dwm leak issue. I'm going ahead and marking this thread as resolved! Please note that we'll specifically call out this fix in the release notes of our next production driver release to the Download Center which will be found here once available.
Special thanks to @HKlum, @TurboTacho, @Ansuel, and the MANY others that dedicated their time testing and providing various dump files. I really appreciate you all sticking by our side after all this time to make sure this long-standing problem gets resolved. You folks are what make this Community forum so great. We couldn't have done it without you! 😊
For those of you that continue to exhibit issues: Please create new individual threads so we can assess if it is a separate issue or not for your particular case.
Thanks again everyone!!
Link Copied
- Mark as New
- Bookmark
- Subscribe
- Mute
- Subscribe to RSS Feed
- Permalink
- Report Inappropriate Content
The problem persisted, I downgraded even further to Driver Version: 26.20.100.8141 . After a clean installation using DDU the memory usage has been stable for a couple of hours. I'm leaving these comments in the hope to help other people.
- Mark as New
- Bookmark
- Subscribe
- Mute
- Subscribe to RSS Feed
- Permalink
- Report Inappropriate Content
Most concerning is that this has been ongoing for so long, yet there seems to be no welcome fix for it?
I have a 10th gen i7 laptop which leaks from 53MB to >2GB gradually after a matter of hours until the system slows to a halt... just by doing regular things like e-mail and web surfing. Tried disabling hardware acceleration in Chrome/etc. Tried downgrading drivers (but the 630 isn't supported on the last-known non-leaking drivers of 100.6286) as well as upgrading to the latest- had 5-6 driver versions explicitly installed such as 100.9168, 100.8476, and always has the same results.
Intel- if you want a use case I'm happy to make you dump files. Just need this fixed. All of the 'solutions' here aren't solutions at all- just people restarting DWM to have it reset, or turning on full reboots which resets it to allow it to leak again.
Intel?
- Tags:
- inteldoesntcare
- Mark as New
- Bookmark
- Subscribe
- Mute
- Subscribe to RSS Feed
- Permalink
- Report Inappropriate Content
So.. last week, I was digging into windows setting that handle scaling. then I'm turning off "Let Windows try to fix apps so they're not blurry". Now I got average 40-55MB of usage.

P.S. I have 27.21.14.6140 driver installed, Let me know if this is work on you. (sorry for bad english)
- Mark as New
- Bookmark
- Subscribe
- Mute
- Subscribe to RSS Feed
- Permalink
- Report Inappropriate Content
I'm turning off "Let Windows try to fix apps so they're not blurry". Now I got average 40-55MB of usage.
Where have you been all my life?
This is the ONLY thing on this forum that has worked. It grew to 75MB and stayed there. Way better than 2GB.
EDIT: On the next reboot we're back over 1GB after an hour. That was a waste of time. Remains unfixed for months and between Intel and Microsoft, nobody seems to care.
- Mark as New
- Bookmark
- Subscribe
- Mute
- Subscribe to RSS Feed
- Permalink
- Report Inappropriate Content
No problems on LTSC 2019 so far

Intel(R) HD Graphics 630 27.20.100.8681
- Mark as New
- Bookmark
- Subscribe
- Mute
- Subscribe to RSS Feed
- Permalink
- Report Inappropriate Content
27.20.100.8681 will start to leak after 2 weeks of use. I'm turning off "Let Windows try to fix apps so they're not blurry" . The problem persisted!
Only downgrade uses 27.20.100.8476.But will be forced to update automatically after a month
- Mark as New
- Bookmark
- Subscribe
- Mute
- Subscribe to RSS Feed
- Permalink
- Report Inappropriate Content
I have the same problem, Intel UHD Graphics 630 on a laptop that also has NVIDIA GTX 1060. Driver version 27.20.100.9126, and many before are plagued by this. Windows 10 20H2.
After a few days I'll notice DWM.exe using a lot of Committed memory, sometimes up to 6 GiB.
I believe it only starts to happen after a sleep cycle.
What did not help:
- Disabling "fast startup" in Power Options.
- Disabling "Fix apps that are blurry".
I was lucky enough to catch the issue as it was happening, just now. While I was watching a Twitch stream in Firefox, the memory usage of DWM would constantly grow by 1-2 MB/s, and if I paused the stream, it would stop growing. Maybe watching any type of video in a browser is affected, I don't know. Let me know if any of you affected people are/aren't using Firefox. Might be a factor here. (In any case this is not a browser bug, it's definitely a DWM or a driver bug, but it might be triggered by the behavior of a browser in this case).
What I did then is try to capture memory allocations with UIforETW as described here: https://randomascii.wordpress.com/2015/04/27/etw-heap-tracingevery-allocation-recorded/ While it seems I cannot capture heap allocations since it requires dwm.exe restart, I can see "VirtualAlloc Commit Lifetimes" that seem to indicate allocations that were later not de-allocated.
(I can maybe make dwm.exe heap allocations work if I change its settings in the registry and reboot? I'll try that maybe)
See screenshots below. This is a capture of 23 second period where DWM memory usage was growing.. You can see on the graph that it allocated 35 MB of memory (and did not deallocate it as far as I understand).
I added Commit Stack column to see where the allocation did happen. So I guess DWM uses d2d1.dll (Direct2D rendering, probably because Firefox uses it), which then triggers d3d11.dll code and it eventually gets to igd10iumd64.dll (Intel's driver DLL) to draw the stuff on screen. That's the DLL that allocates memory.
While we can see function names of the Microsoft code (since I loaded in the symbols), the names for the Intel DLL are not available. If symbols for Intel are available anywhere, let me know.
I will not share the trace file since it has my private data, but I hope these call stacks might help someone on the Microsoft or Intel side, if anyone's reading this. If you have any questions, I'll be happy to answer.


Thanks.
- Mark as New
- Bookmark
- Subscribe
- Mute
- Subscribe to RSS Feed
- Permalink
- Report Inappropriate Content
- Mark as New
- Bookmark
- Subscribe
- Mute
- Subscribe to RSS Feed
- Permalink
- Report Inappropriate Content
@Stefan3D thanks, but it seems they are only hosting .DLL files, however Windows Performance Analyzer is looking for .PDB files.
- Mark as New
- Bookmark
- Subscribe
- Mute
- Subscribe to RSS Feed
- Permalink
- Report Inappropriate Content
Another user chiming in with my own machine exhibiting the same issue. Mine only started after updating to the intel display driver from late January. It seems okay for a few hours but after resuming from sleep I notice that the memory usage skyrockets for the DWM. This laptop has that new "Modern Standby" ability, not sure if it's related or not.
Dell Vostro 7500
Core i7-10750H
Nvidia GeForce GTX 1650Ti
Windows 10
Version 20H2
Build 19042.804
Intel Driver: 27.20.100.8935
Nvidia Driver: 27.21.14.6140
- Mark as New
- Bookmark
- Subscribe
- Mute
- Subscribe to RSS Feed
- Permalink
- Report Inappropriate Content
Oh I suffered from this for quite a time
Surprisingly, the latest Intel BETA igfx_win10_100.9313.exe driver did solve it for me. For around 3 days I'm seeing that dwm doesn't exceed 200 mb and does not invoves GPU to its activites anymore, when earlier it could take 70% of GPU power for no reason
Maybe will help someone: https://downloadcenter.intel.com/download/30248/Intel-Graphics-BETA-Windows-10-DCH-Drivers
- Mark as New
- Bookmark
- Subscribe
- Mute
- Subscribe to RSS Feed
- Permalink
- Report Inappropriate Content
Thanks JeyKey555! This beta driver solved the high GPU utilization for me. It did not reduce DWM high memory usage though. Maybe the high memory usage is not a bug.
- Mark as New
- Bookmark
- Subscribe
- Mute
- Subscribe to RSS Feed
- Permalink
- Report Inappropriate Content
If LTSC 2019 has no memory leak, this might indicate such memory leakage is also related with Windows 10 update as well. LTSC 2019 is a build based on 1809.
My personal laptop updated to 20H2 directly from 1809 on 10/30/2020. Window update automatically updated my graphics driver to 27.20.100.8587 and the problem occurred. I didn't spot the problem until 10 days after so I didn't have a chance to roll back to the previous version. I just browse through the entire thread again and all of us are using 2004/20H2. Perhaps anyone with windows 1809 could test the latest driver and check if my hypothesis is true.
However, even if there is no memory leak in 1809, it is hard to say 1809 is completely safe, given the fact that intel staff couldn't reproduce this memory leak issue with 2004 and 8681. We still don't know what triggered this problem, otherwise we could help our intel staff to reproduce the problem. It seems that not everyone is experiencing this issue, or has not discovered this issue yet. But for us, every time we start our machine we find memory leaks, and this is why we gathered here.
Fun correlation(might be) that I found: At the beginning of this thread, we thought only those computers with Nvidia graphics cards were experiencing this issue. I assume the reason for this might be that those users with Nvidia graphics card are using more memory intensive porgrams and therefore more concerned about memory usage than users without such cards. For an ordinary users, he or she might or even notice this issue or restart the computer only when it feels laggy without looking for what might caused it. I suspect that this bug may exist more widely than we thought.
I'll try 27.20.100.9313 for myself tomorrow. But I did get a feedback today from someone that the issue still exists with 30.20.100.9314.
- Mark as New
- Bookmark
- Subscribe
- Mute
- Subscribe to RSS Feed
- Permalink
- Report Inappropriate Content

- Mark as New
- Bookmark
- Subscribe
- Mute
- Subscribe to RSS Feed
- Permalink
- Report Inappropriate Content
@Ken_Lei and neither for me anymore, well partially, acts weird - RAM usage either going up or standing still for the entire day. Yep, this isn't a solution.. Hope Intel will ever notice this
- Mark as New
- Bookmark
- Subscribe
- Mute
- Subscribe to RSS Feed
- Permalink
- Report Inappropriate Content
Hi again everyone,
I apologize for not replying sooner, yet rest assured that we have been monitoring this thread/issue closely.
Currently our recommendation still stands as before i.e. report this directly to Microsoft particularly because we don't have a reproducible case yet, and the bug only appears to affect a relative small subset of users/configurations.
From our side, I would appreciate if you can provide the dump files (different dwm sizes such as minimum, mid range, and very high) and while I can't promise any outcome I'll have our devs look into it.
The instructions to pull the reports can be as follows:
- Roll back driver to 100.8587.
- Turn PC completely off, then boot.
- Open Task Mgr > Details tab.
- Right click dwm.exe
- Select "Create dump"
- Use PC normally and wait until dwm grows about mid range.
- Repeat steps 3 & 4
- Use PC normally and wait until dwm grows very high in the GB range.
- Repeat steps 3 & 4.
- Send Intel the dmp files.
The dump will be easy to find, this message pops up after completing. Per example:

Thank you for any help you can provide us with this one.
Best Regards,
Ronald M.
- Mark as New
- Bookmark
- Subscribe
- Mute
- Subscribe to RSS Feed
- Permalink
- Report Inappropriate Content
Thanks for the suggestions Ronald.
Below is a link of two dump files you requested, each one has a suffix which indicate the memory usage in task manager at the time the dump file was created. I've also included an SSU output from the time that memory usage was very high. Hope this helps.
https://mega.nz/folder/wwYTySzA#z5p98zbDJmZlml0pBgJWDQ
- Mark as New
- Bookmark
- Subscribe
- Mute
- Subscribe to RSS Feed
- Permalink
- Report Inappropriate Content
The problem with the suggested dump files is, that without exception the ExceptionAddress is always 0
Where do you want to start disassembling?
- Mark as New
- Bookmark
- Subscribe
- Mute
- Subscribe to RSS Feed
- Permalink
- Report Inappropriate Content
Hi
When I installed the Intel BETA igfx_win10_100.9313.exe driver, this solved my problem of high memory usage (1800-2500 Mb). I was happy about it and memory usage became about 200-300 Mb. But today I installed the latest stable version - igfx_win10_100.9316.exe driver and now I see that the problem is back again. Memory usage by dwm.exe is about 1800Mb.
This is again very sad...
- Mark as New
- Bookmark
- Subscribe
- Mute
- Subscribe to RSS Feed
- Permalink
- Report Inappropriate Content
- Mark as New
- Bookmark
- Subscribe
- Mute
- Subscribe to RSS Feed
- Permalink
- Report Inappropriate Content
Can confirm that downgrading to driver version 27.20.100.8476 fixed the issue for me as well, haven't seen a single memory spike with DWM since using this driver unlike the latest which was causing multiple GBs of memory leaks sadly. I've disabled updates for this device so it doesn't update automatically in the mean time until this bug gets fixed. Thanks all the people in this thread for trying to solve it, appreciate the help!
- Subscribe to RSS Feed
- Mark Topic as New
- Mark Topic as Read
- Float this Topic for Current User
- Bookmark
- Subscribe
- Printer Friendly Page