- 新着としてマーク
- ブックマーク
- 購読
- ミュート
- RSS フィードを購読する
- ハイライト
- 印刷
- 不適切なコンテンツを報告
My system is Lenovo Thinkedge SE30 with vPRO. AMT has been configured.
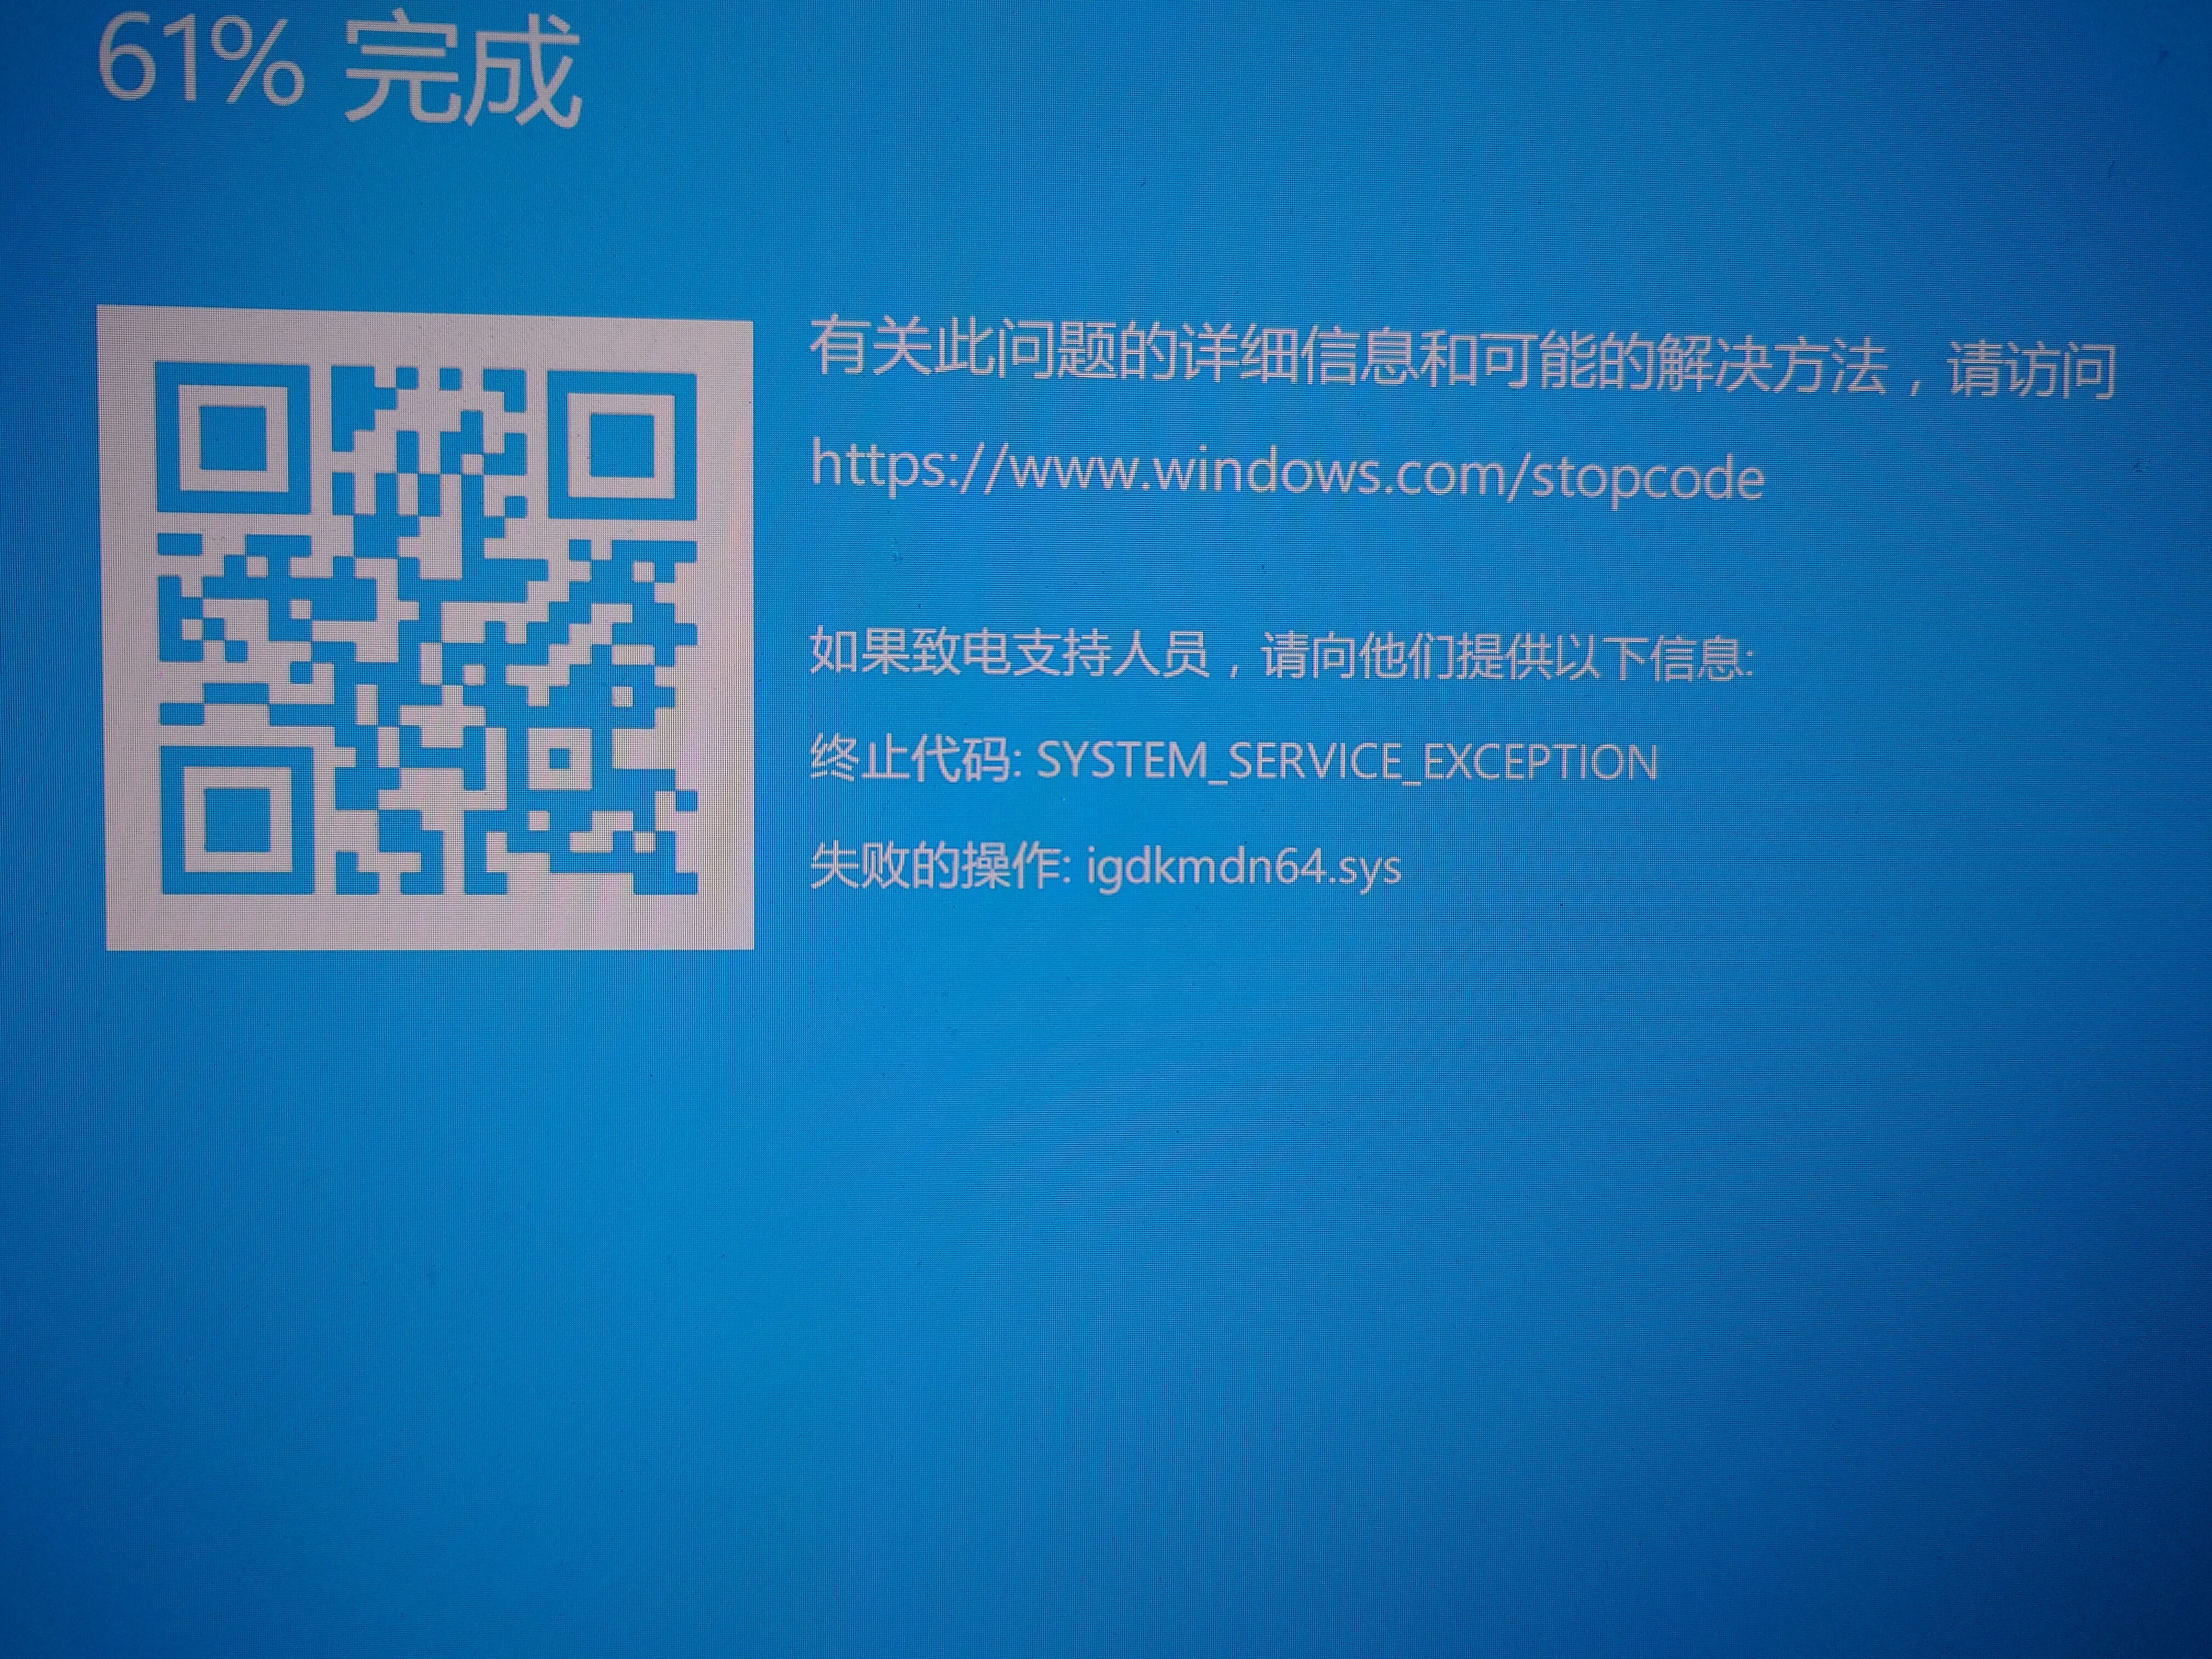
Starting a Remote desktop or Serial Over LAN session remotely will immediately cause the system to crash with code "SYSTEM_SERVICE_EXCEPTION" and the related module igdkmdn64.sys.
Uninstalling the Xe graphic driver can prevent any crashes from happening.
コピーされたリンク
- 新着としてマーク
- ブックマーク
- 購読
- ミュート
- RSS フィードを購読する
- ハイライト
- 印刷
- 不適切なコンテンツを報告
Tried Intel® Manageability Commander and MeshCommander, and both of them behaved the same.
- 新着としてマーク
- ブックマーク
- 購読
- ミュート
- RSS フィードを購読する
- ハイライト
- 印刷
- 不適切なコンテンツを報告

Log from Tried Intel® Manageability Commander
- 新着としてマーク
- ブックマーク
- 購読
- ミュート
- RSS フィードを購読する
- ハイライト
- 印刷
- 不適切なコンテンツを報告
5: kd> !analyze -v
*******************************************************************************
* *
* Bugcheck Analysis *
* *
*******************************************************************************
SYSTEM_SERVICE_EXCEPTION (3b)
An exception happened while executing a system service routine.
Arguments:
Arg1: 00000000c0000005, Exception code that caused the BugCheck
Arg2: fffff801972eb9f6, Address of the instruction which caused the BugCheck
Arg3: ffffa38aec174c40, Address of the context record for the exception that caused the BugCheck
Arg4: 0000000000000000, zero.
Debugging Details:
------------------
KEY_VALUES_STRING: 1
Key : Analysis.CPU.mSec
Value: 1889
Key : Analysis.DebugAnalysisManager
Value: Create
Key : Analysis.Elapsed.mSec
Value: 8583
Key : Analysis.IO.Other.Mb
Value: 0
Key : Analysis.IO.Read.Mb
Value: 0
Key : Analysis.IO.Write.Mb
Value: 0
Key : Analysis.Init.CPU.mSec
Value: 421
Key : Analysis.Init.Elapsed.mSec
Value: 25841
Key : Analysis.Memory.CommitPeak.Mb
Value: 93
Key : Bugcheck.Code.DumpHeader
Value: 0x3b
Key : Bugcheck.Code.Register
Value: 0x3b
Key : Dump.Attributes.AsUlong
Value: 8
Key : Dump.Attributes.KernelGeneratedTriageDump
Value: 1
FILE_IN_CAB: 040423-8312-01.dmp
DUMP_FILE_ATTRIBUTES: 0x8
Kernel Generated Triage Dump
BUGCHECK_CODE: 3b
BUGCHECK_P1: c0000005
BUGCHECK_P2: fffff801972eb9f6
BUGCHECK_P3: ffffa38aec174c40
BUGCHECK_P4: 0
CONTEXT: ffffa38aec174c40 -- (.cxr 0xffffa38aec174c40)
rax=0000000000000000 rbx=ffffb585246c5490 rcx=ffffb585246c5490
rdx=0000000000000001 rsi=ffffb5852de3e000 rdi=ffffb585246c5490
rip=fffff801972eb9f6 rsp=ffffa38aec175640 rbp=ffffb585246ef010
r8=000000006c0cfb63 r9=0000000000000004 r10=fffff8016dd65240
r11=ffffa38aec175698 r12=ffffb585246c5490 r13=ffffb5851ccb7db0
r14=0000000000000000 r15=0000000000000000
iopl=0 nv up ei ng nz na po nc
cs=0010 ss=0018 ds=002b es=002b fs=0053 gs=002b efl=00050286
igdkmdn64+0x19b9f6:
fffff801`972eb9f6 4c8b00 mov r8,qword ptr [rax] ds:002b:00000000`00000000=????????????????
Resetting default scope
BLACKBOXBSD: 1 (!blackboxbsd)
BLACKBOXNTFS: 1 (!blackboxntfs)
BLACKBOXWINLOGON: 1
CUSTOMER_CRASH_COUNT: 1
PROCESS_NAME: csrss.exe
STACK_TEXT:
ffffa38a`ec175640 ffffb585`245f01c0 : fffff801`6dce086b ffff9c19`ec766f96 00000000`00000000 ffffb585`246c2010 : igdkmdn64+0x19b9f6
ffffa38a`ec175648 fffff801`6dce086b : ffff9c19`ec766f96 00000000`00000000 ffffb585`246c2010 fffff801`97330993 : 0xffffb585`245f01c0
ffffa38a`ec175650 fffff801`972dcb25 : ffffb585`2de3e000 00000000`00000001 00000000`00000000 ffffb585`249280c8 : nt!KiWakeQueueWaiter+0x9b
ffffa38a`ec1756a0 ffffb585`2de3e000 : 00000000`00000001 00000000`00000000 ffffb585`249280c8 00000780`00000000 : igdkmdn64+0x18cb25
ffffa38a`ec1756a8 00000000`00000001 : 00000000`00000000 ffffb585`249280c8 00000780`00000000 ffffb585`16e02280 : 0xffffb585`2de3e000
ffffa38a`ec1756b0 00000000`00000000 : ffffb585`249280c8 00000780`00000000 ffffb585`16e02280 ffffb585`24927010 : 0x1
SYMBOL_NAME: igdkmdn64+19b9f6
MODULE_NAME: igdkmdn64
IMAGE_NAME: igdkmdn64.sys
STACK_COMMAND: .cxr 0xffffa38aec174c40 ; kb
BUCKET_ID_FUNC_OFFSET: 19b9f6
FAILURE_BUCKET_ID: AV_igdkmdn64!unknown_function
OSPLATFORM_TYPE: x64
OSNAME: Windows 10
FAILURE_ID_HASH: {12102b79-db74-3949-6de5-0951c15a29fa}
Followup: MachineOwner
---------
- 新着としてマーク
- ブックマーク
- 購読
- ミュート
- RSS フィードを購読する
- ハイライト
- 印刷
- 不適切なコンテンツを報告
Hello LeiNade,
Thank you for posting on the Intel®️ communities. I am sorry to hear that you are having Blue Screen of Death issues, I will be happy to help you.
To have a better understanding of the situation, please answer the following questions:
- When did the issue start?
- Download, run, save and attach the report for the following tool Intel® System Support Utility for Windows (SSU), you can find the steps on the link How to get the Intel® System Support Utility Logs on Windows.
Regards,
Andres P.
Intel Customer Support Technician
- 新着としてマーク
- ブックマーク
- 購読
- ミュート
- RSS フィードを購読する
- ハイライト
- 印刷
- 不適切なコンテンツを報告
I will continue on the AMT subforum, thanks a lot for your help.
- 新着としてマーク
- ブックマーク
- 購読
- ミュート
- RSS フィードを購読する
- ハイライト
- 印刷
- 不適切なコンテンツを報告
Hello LeiNade,
Thank you for your response.
As you are being helped on another thread, so we will close this thread. If you need any additional information, please submit a new question as this thread will no longer be monitored.
Regards,
Andres P.
Intel Customer Support Technician