- Mark as New
- Bookmark
- Subscribe
- Mute
- Subscribe to RSS Feed
- Permalink
- Report Inappropriate Content
We're seeing a memory leak in our app when its used on systems with the Intel Xe Iris graphics card. Memory profiling has shown that the leak is happening in the igdgmm32.dll (version 27.20.100.9749). I also tried it with version 30.0.101.1069. Memory allocated by that dll grows by about 4MB at the end of many (but not all) Direct2D EndDraw calls. Over time, this is leading our users to see out of memory errors.
I've created a minimal repro at https://github.com/rockhymas/directleak. There is a .NET app and native win32 app. Though I don't see consistent memory leaks with this app, there is a notable difference in memory used on systems with the Intel Xe Iris card vs another machine, that is using the Intel UHD 630 graphics driver. On the Xe Iris system, I see the memory usage balloon up by 4MB on the first call to EndDraw. On the other one, it never goes over about 500KB.
Any ideas what may be going on here?
Link Copied
- Mark as New
- Bookmark
- Subscribe
- Mute
- Subscribe to RSS Feed
- Permalink
- Report Inappropriate Content
Hello @RockHymas
Thank you for posting on the Intel® communities.
In regards to this behavior, could you please confirm or provide the following details:
1- Is this is an app that you are currently developing? Or is it an app that has been officially released? (e.g.: a commercial app already available to the public or in production in your company?)
2- Just to make sure, is this happening with the customized graphics drivers provided by the computer manufacturer (OEM)? (For instance, version 27.20.100.9749?)
3- We noticed you shared some files (app's code) on GitHub*. Could you please provide detailed step-by-step instructions for reproduction purposes with those files?
4- On one of the systems experiencing the behavior, please run the Intel® System Support Utility (Intel® SSU) to gather more details and provide us with the report:
- Download the Intel® SSU and save the application on your computer
- Open the application, check the "Everything" checkbox, and click "Scan" to see the system and device information. The Intel® SSU defaults to the "Summary View" on the output screen following the scan. Click the menu where it says "Summary" to change to "Detailed View".
- To save your scan, click Next and click Save.
- Once you have saved the file (.txt file), please attach it to your reply.
To upload and attach a file, use the "Drag and drop here or browse files to attach" option below the response textbox.
Best regards,
Andrew G.
Intel Customer Support Technician
- Mark as New
- Bookmark
- Subscribe
- Mute
- Subscribe to RSS Feed
- Permalink
- Report Inappropriate Content
1- We're seeing it in our already released product: Storyline. It's available as part of a 360 trial at https://articulate.com/360.
2- Seeing this with both version 27.20.100.9749 of the drivers, as well as version 30.0.101.1069.
3-
1. Open the solution in Visual Studio and build it. (alternatively, I've attached a copy of the built executable and supporting dlls in directleak.zip)
2. Run the DirectLeak C# project
3. If you click on the button, the form will start painting using DirectWrite to render some text
4. At this point, on the affected systems, we see memory allocated by igdgmm32.dll bump up to 4mb. On other systems it never goes above 1mb
5. This is not exactly what we see with Storyline, but it's similar.
4. Attached
- Mark as New
- Bookmark
- Subscribe
- Mute
- Subscribe to RSS Feed
- Permalink
- Report Inappropriate Content
Hello RockHymas
Thank you very much for your response and for these details.
We would like to inform you that we have released a new production driver two days ago. Before we move forward, we recommend testing the behavior with this new driver.
Please execute a Clean Installation of Intel® Graphics Drivers in Windows* to install the Intel® Graphics DHC driver Version 30.0.101.1121 (Latest). During the process, please make sure all steps are followed, including disconnecting from the Internet and making sure you get to the Microsoft Basic Display Adapter before trying to install the graphics driver.
Please let us know if the behavior is different or the same.
Best regards,
Andrew G.
Intel Customer Support Technician
- Mark as New
- Bookmark
- Subscribe
- Mute
- Subscribe to RSS Feed
- Permalink
- Report Inappropriate Content
Hi Andrew,
Ok, I've got the latest driver, verified it's the version 30.0.101.1121, and I'm still seeing the leak in igdgmm32.dll. The behavior is the same.
Thanks,
Rock
- Mark as New
- Bookmark
- Subscribe
- Mute
- Subscribe to RSS Feed
- Permalink
- Report Inappropriate Content
Hello,
we also experience memory leak, we use multiple windows with one opengl view per window. There is no memory leak with one window but when we open more windows we observe fast growing memory usage. It did not happen with 26.x versions and it does not happen with Nvidia. In our tests we tried to delete buffers (glDeleteBuffers) after every frame and it helped to remove memory leak but this is not correct solution as we want to keep buffers (glGenBuffers is used only once we create window). Also this were not needed for earlier drivers. glBindBuffer should be just enough. We have many customers who use our software and many use laptops with Intel graphics. They are not able to use our application at this moment because of this bug. I am a software developer and if you need help to reproduce this issue we can communicate directly with your team to mitigate this problem.
Thanks!
- Mark as New
- Bookmark
- Subscribe
- Mute
- Subscribe to RSS Feed
- Permalink
- Report Inappropriate Content
Hello @Leonid007
Thank you for posting on the Intel® communities and for your feedback.
Everyone's situation and environment are unique so we kindly recommend creating a new thread to isolate your case and system configuration, please make sure you add the information of the system model and specs, detailed information of the problem that you are having, plus all the information that you have added to this thread, so we can get more information about the problem.
Thank you for your understanding; hope to hear from you soon.
Best regards,
Andrew G.
Intel Customer Support Technician
- Mark as New
- Bookmark
- Subscribe
- Mute
- Subscribe to RSS Feed
- Permalink
- Report Inappropriate Content
Hello RockHymas
Thank you for your response and for testing with the latest driver. Please allow us to review this further and we will be posting back in the thread as soon as more details are available.
Best regards
Andrew G.
Intel Customer Support Technician
- Mark as New
- Bookmark
- Subscribe
- Mute
- Subscribe to RSS Feed
- Permalink
- Report Inappropriate Content
Hello RockHymas
We are still working on this matter and we would like you to test a new driver available. Could you please try one more time the steps in the article Clean Installation of Intel® Graphics Drivers in Windows* but this time using the new driver Version 30.0.101.1191?
Also, could you please confirm the Visual Studio version that you are using?
Best regards,
Andrew G.
Intel Customer Support Technician
- Mark as New
- Bookmark
- Subscribe
- Mute
- Subscribe to RSS Feed
- Permalink
- Report Inappropriate Content
Hi Andrew
Thanks for continuing to investigate. Unfortunately, even with version 30.0.101.1191the leak in igdgmm32.dll is happening.
Regards,
Rock
- Mark as New
- Bookmark
- Subscribe
- Mute
- Subscribe to RSS Feed
- Permalink
- Report Inappropriate Content
Hello RockHymas
Thank you for your response.
It seems we are missing the confirmation of the Visual Studio version that you use. Could you please confirm this information? Otherwise, our tests are conducted just using the latest version available.
Also, could you please perform two more steps and let us know if the behavior still persists?
1- Update Windows* to the latest version 21H2 (Build 19044).
2- Update the BIOS to the latest version. The system is currently running version 1.9.3 (as per Intel® SSU report). There are 3 newer Versions available on the DELL* website, the latest version is 1.13.0.
Thank you in advance for your efforts in this matter.
Best regards,
Andrew G.
Intel Customer Support Technician
- Mark as New
- Bookmark
- Subscribe
- Mute
- Subscribe to RSS Feed
- Permalink
- Report Inappropriate Content
Okay, getting back to this.
The version of Visual Studio I'm using is 16.11.3 (VS 2019)
I've updated the Windows version, as well as the BIOS. The process of doing that, for some reason, reset my Intel XE Iris graphics drive to 27. So I re-installed the latest driver (30.0.101.1191).
After all that, I'm still seeing the memory leak.
Thanks,
Rock
- Mark as New
- Bookmark
- Subscribe
- Mute
- Subscribe to RSS Feed
- Permalink
- Report Inappropriate Content
Hello RockHymas
We are checking this thread and we would like to know if you were able to review our previous post. If you need further assistance, please do not hesitate to contact us back.
Best regards,
Andrew G.
Intel Customer Support Technician
- Mark as New
- Bookmark
- Subscribe
- Mute
- Subscribe to RSS Feed
- Permalink
- Report Inappropriate Content
Hello RockHymas
Thank you very much for your response and for your feedback regarding the outcome of the steps. As soon as we have more details available regarding this, we will be posting them here in the thread.
Best regards,
Andrew G.
Intel Customer Support Technician
- Mark as New
- Bookmark
- Subscribe
- Mute
- Subscribe to RSS Feed
- Permalink
- Report Inappropriate Content
Hello RockHymas
We have been working on testing this and trying to review the memory leak behavior.
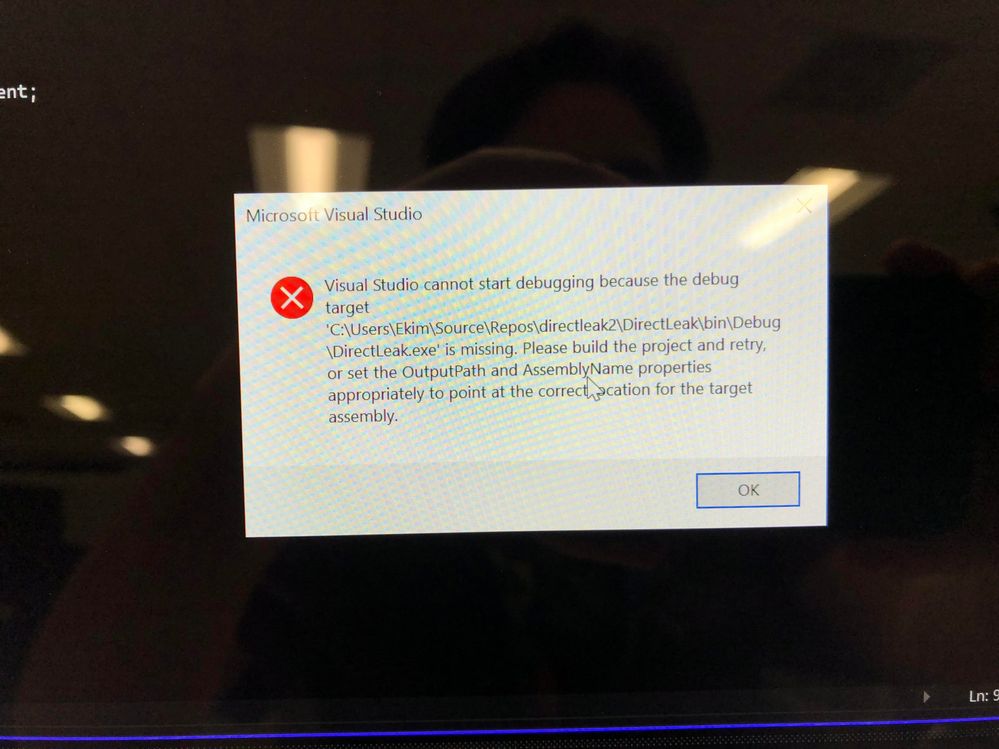
We downloaded Visual Studio and tried to build the source code by transferring the repository you provided, but when we tried to run the code we were getting the error:
- "Visual Studio cannot start debugging because the debut target C:\Users\Ekim\Source\Repos\direcleak2\DirectLeak\bin\Debug\DirectLeak.exe is missing. Please build the project and retry or set the OutputPath and AssemblyName properties appropriately to point at the correct location for the target assembly"
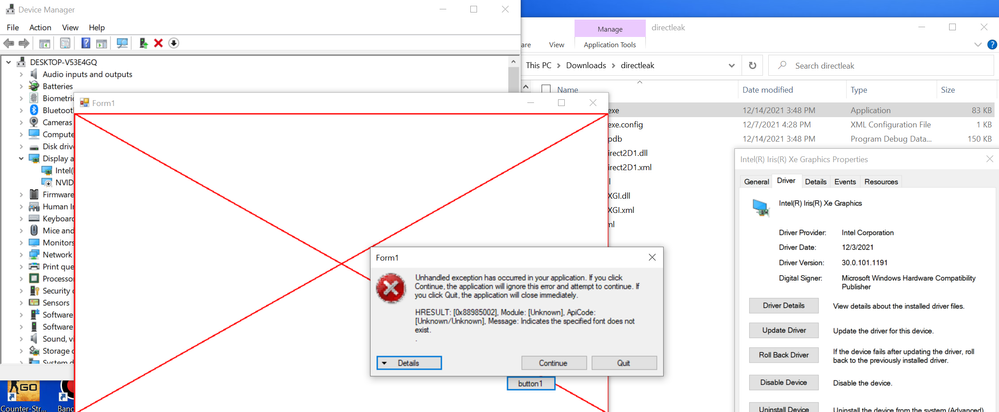
Then we tried to run the executable you provided, it showed a box with the option to press "button 1" and after that, it showed the following error:
- "Unhandled exception has occurred in your application. If you click continue, the application will ignore this error and attempt to continue. If you click quit, the application will close immediately
- HRESULT: [0x88985002], Module: [Unknown], ApiCode: [Unknown/Unknown], Message: Indicates the specified font does not exist"
We tried to run this executable using the driver version 30.0.101.1191 and then used 27.20.100.9466 but it gave the same error.
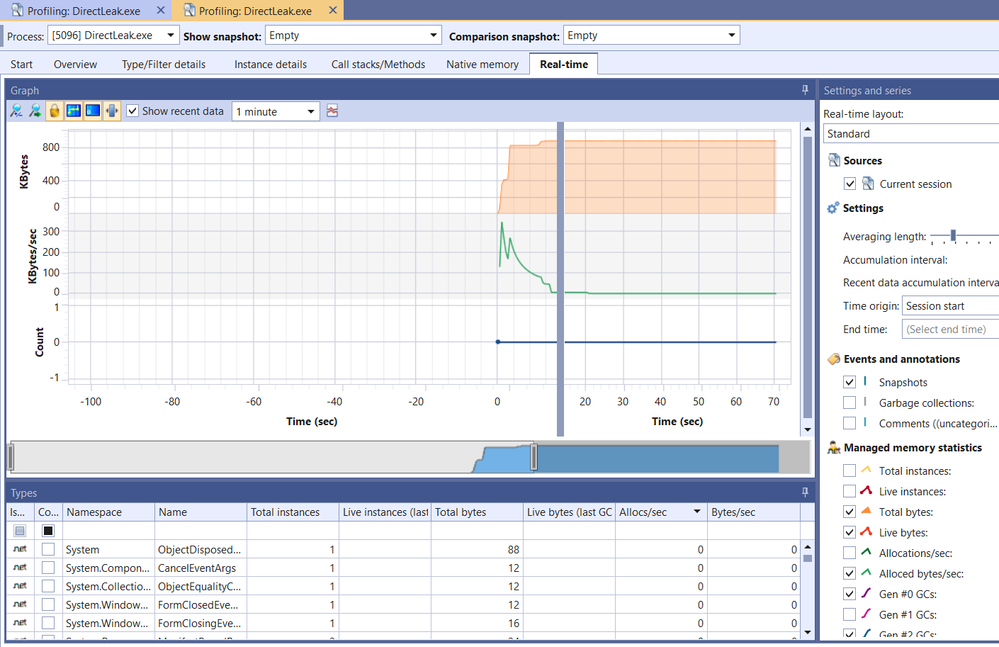
Probably that's why we couldn't find memory leaks for this app as shown on the image attached:
In this case, could you please provide us with a new solution to build or some workaround to start it?
Thank you in advance for your help in this matter.
Best regards,
Andrew G.
Intel Customer Support Technician
- Mark as New
- Bookmark
- Subscribe
- Mute
- Subscribe to RSS Feed
- Permalink
- Report Inappropriate Content
Ok, here goes 🙂
When you build the project and try to run it, were there any build errors? The error you see when trying to run indicates that the executable wasn't built for some reason.
Yes, the version I built and and gave to you referred to a font that I forgot isn't standard on most systems. I've updated the code to just use Arial, so if you try to rebuild the project, first pull the latest from github.
Also, I've attached a new version of the built executable, which also uses Arial as the font. The button in the app causes the first directX painting to happen, and that's when I see the memory used by igdgmm32.dll jump way up.
Thanks,
Rock
- Mark as New
- Bookmark
- Subscribe
- Mute
- Subscribe to RSS Feed
- Permalink
- Report Inappropriate Content
Hello RockHymas
Thank you very much for the updated versions of the code and project, and for the clarifications. We really appreciate it.
We're going to proceed to test the updated versions and we will be posting back in the thread as soon as more details are available.
Sincerely,
Andrew G.
Intel Customer Support Technician
- Mark as New
- Bookmark
- Subscribe
- Mute
- Subscribe to RSS Feed
- Permalink
- Report Inappropriate Content
Hi Andrew,
Any update on this? We have customers who are affected by the issue that are very frustrated, and we'd like to get it resolved for them soon.
Thank you,
Rock
- Subscribe to RSS Feed
- Mark Topic as New
- Mark Topic as Read
- Float this Topic for Current User
- Bookmark
- Subscribe
- Printer Friendly Page


