- Marcar como nuevo
- Favorito
- Suscribir
- Silenciar
- Suscribirse a un feed RSS
- Resaltar
- Imprimir
- Informe de contenido inapropiado
I have VS Pro 2022 Version 17.10.4
Intel Fortran Compiler 2024.1
Compiled code with IFX.
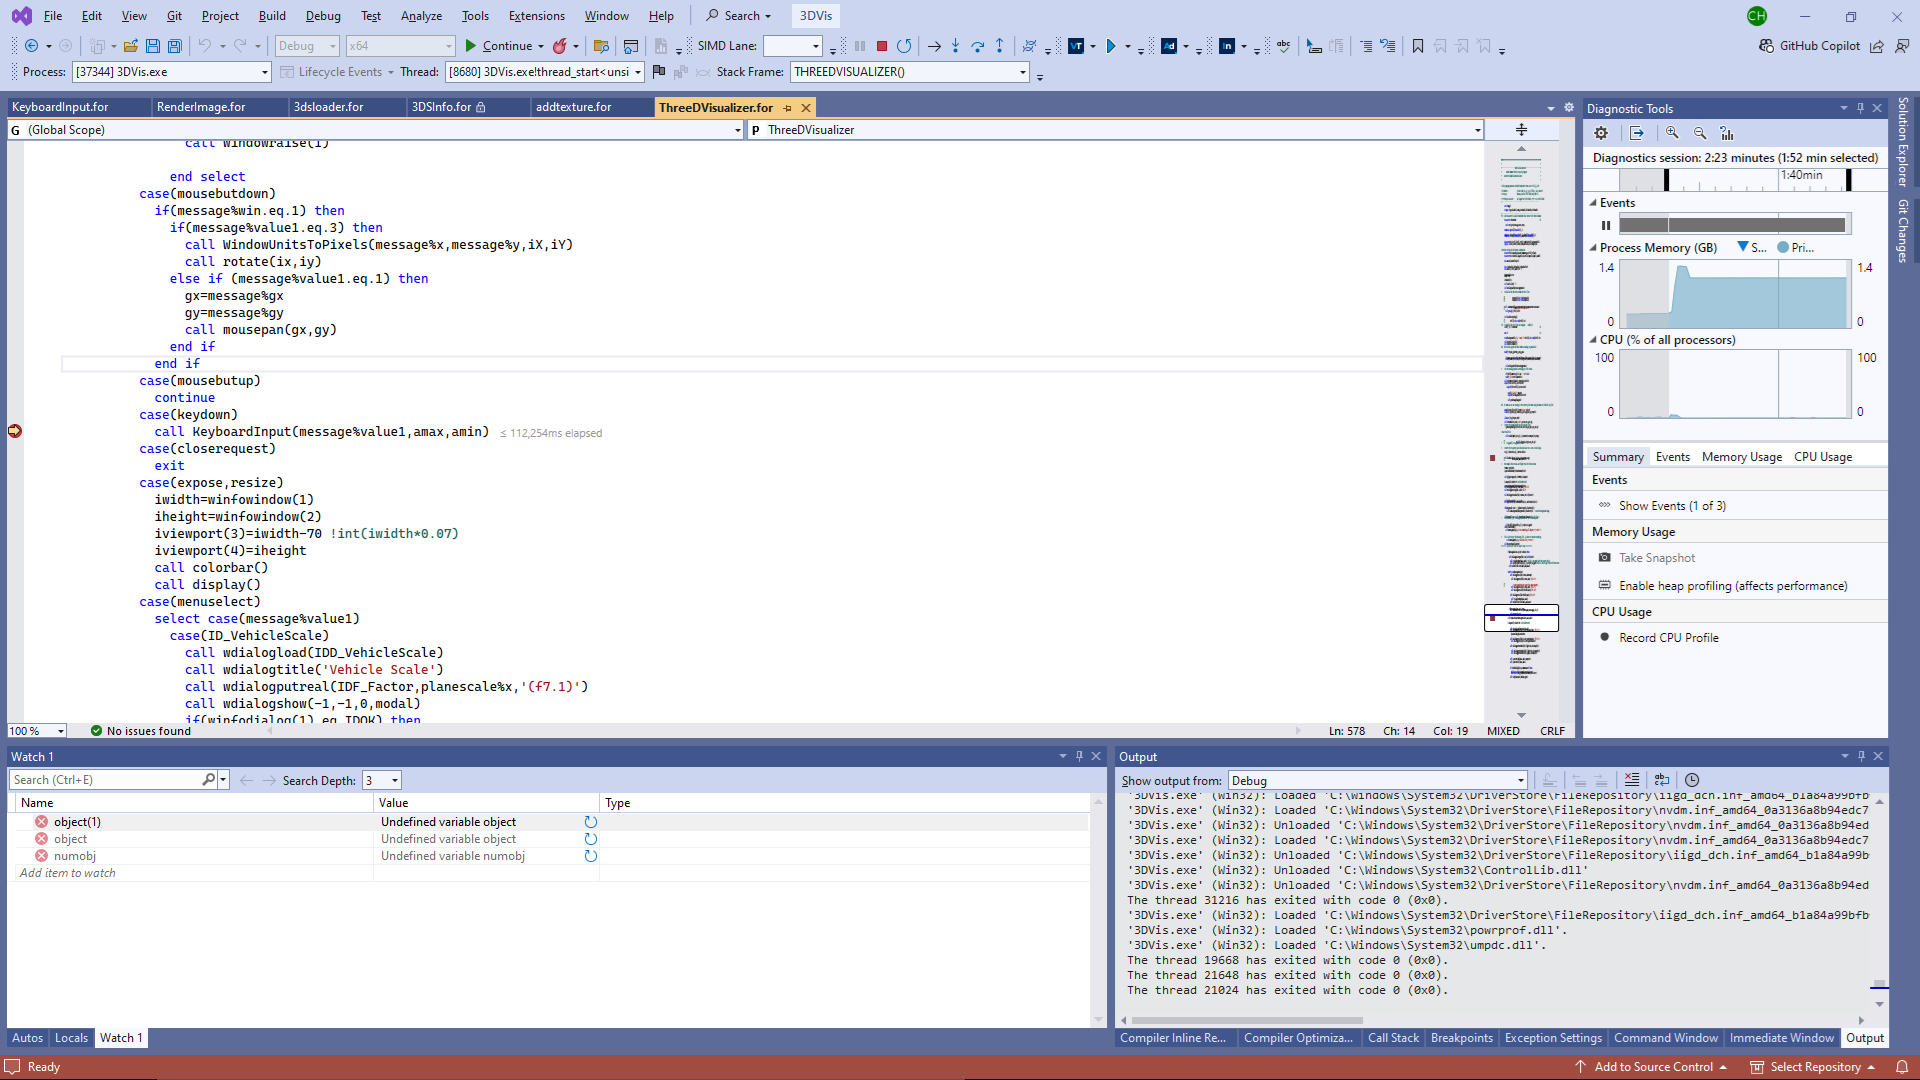
When I put a break point in a line of code in main routine the execution stops at the line. When I press F11 to step into the subroutine I get the message that *.for of the main code that I stopped execution in could not be found.
I made the mistake of upgrading the VS2022 when the previous version showed signs of corruption. I also upgraded the OneAPI base and HPC toolkit. I do see that these versions of the compiler and VS have not been validated.
As I am unable to find the Intel registration center to put in a support ticket, I am hoping someone here might help.
Suggestions on how to get back to work would be greatly appreciated. Thank you.
- Marcar como nuevo
- Favorito
- Suscribir
- Silenciar
- Suscribirse a un feed RSS
- Resaltar
- Imprimir
- Informe de contenido inapropiado
I was having problems and thought the installation of either VS2022 or the compiler got corrupted. So, I updated both. Since you have not validated the pair, I am in new territory. Andrew's point about starting over from scratch would be the best bet, but given the time and intricacy in making sure everything is uninstalled and all hidden dll's are deleted is rather daunting.
I have found that putting a break point at a line in the code that calls a subroutine does stop at program execution at that line; however, as stated above, pressing F11 to step into the subroutine results in a screen indicating that the CALLING source code cannot be found. I have since found that pressing F11 again does result in the debugger stepping into the subroutine. I had not thought to press F11 twice to accomplish my goal. I reckon I will stick with what I have for the moment. Thank you.
Enlace copiado
- Marcar como nuevo
- Favorito
- Suscribir
- Silenciar
- Suscribirse a un feed RSS
- Resaltar
- Imprimir
- Informe de contenido inapropiado
I have not seen that before however I am guessing the routine keyboardInput that you are stepping into is in the file keyboardInput.for and it is that file that isn't found. I would clean and full rebuild your project and ensure that ALL the source files have been compiled successfully with debug settings and that your link command is not pulling in some non-debug obj files.
- Marcar como nuevo
- Favorito
- Suscribir
- Silenciar
- Suscribirse a un feed RSS
- Resaltar
- Imprimir
- Informe de contenido inapropiado
I appreciate the thoughts, Andrew, but the blow up happens when I try to step into a subroutine from the main and the VS2022 says ThreeDVisualizer.for not found even though that is the routine I was activitly stepping through to get to the subroutine I wanted to step into. If I put a breakpoint inside the routine I wanted to step into, then it will run to that breakpoint.
This version of VS2022 and Intel Compiler are behaving in a way that tells me I may have a difficult 6 months or so trying to code until it gets fixed by the crew at Intel. I cannot debug programs outside Visual Studio. So, I'm kinda stuck.
- Marcar como nuevo
- Favorito
- Suscribir
- Silenciar
- Suscribirse a un feed RSS
- Resaltar
- Imprimir
- Informe de contenido inapropiado
Well I and others have used IFX 2024.1 in VS 2022 which suggests to me that you have a specific problem with the project or installation. Why not have a fresh start with the latest compiler?
- Marcar como nuevo
- Favorito
- Suscribir
- Silenciar
- Suscribirse a un feed RSS
- Resaltar
- Imprimir
- Informe de contenido inapropiado
https://supporttickets.intel.com/ to submit a support ticket
@CHobbs1 wrote:
....
As I am unable to find the Intel registration center to put in a support ticket, ...
- Marcar como nuevo
- Favorito
- Suscribir
- Silenciar
- Suscribirse a un feed RSS
- Resaltar
- Imprimir
- Informe de contenido inapropiado
Did you have this issue with the debugger using previous versions of VS? What was the version?
- Marcar como nuevo
- Favorito
- Suscribir
- Silenciar
- Suscribirse a un feed RSS
- Resaltar
- Imprimir
- Informe de contenido inapropiado
I was having problems and thought the installation of either VS2022 or the compiler got corrupted. So, I updated both. Since you have not validated the pair, I am in new territory. Andrew's point about starting over from scratch would be the best bet, but given the time and intricacy in making sure everything is uninstalled and all hidden dll's are deleted is rather daunting.
I have found that putting a break point at a line in the code that calls a subroutine does stop at program execution at that line; however, as stated above, pressing F11 to step into the subroutine results in a screen indicating that the CALLING source code cannot be found. I have since found that pressing F11 again does result in the debugger stepping into the subroutine. I had not thought to press F11 twice to accomplish my goal. I reckon I will stick with what I have for the moment. Thank you.
- Marcar como nuevo
- Favorito
- Suscribir
- Silenciar
- Suscribirse a un feed RSS
- Resaltar
- Imprimir
- Informe de contenido inapropiado
if the subroutine you are stepping into has args that are functions you step into those first and they may not be available....
- Suscribirse a un feed RSS
- Marcar tema como nuevo
- Marcar tema como leído
- Flotar este Tema para el usuario actual
- Favorito
- Suscribir
- Página de impresión sencilla