- Mark as New
- Bookmark
- Subscribe
- Mute
- Subscribe to RSS Feed
- Permalink
- Report Inappropriate Content
Hi,
I have a problem that I am not able to solve with current forum entries.
I have a compiled/linked version of a tool (Compaq Fortran) that runs without hardly touching the memory of Windows 7&8.
Compiled/Linked the same cod on Visual Studio 2013 / "Intel Parallel Studio XE 2016 ... for Fortran"
I use ALLOCATE and DEALLOCATE.
It is a numerical model. For small areas the crash occurs later than for large areas.
I feel I tried any possible combination in the project options, both for Fortran complier and linker.
Can someone help? [sorry if too confused description of my issue]
Thanks in advance
Massimiliano
Link Copied
- Mark as New
- Bookmark
- Subscribe
- Mute
- Subscribe to RSS Feed
- Permalink
- Report Inappropriate Content
There may be many different causes for this. Can you show us the error message?
Also: do yo use modules to make sure the various routines are called with the proper arguments?
You say the crash occurs later for small areas. Are you allocating memory in a loop perhaps? Could you describe the model in a bit more detail?
- Mark as New
- Bookmark
- Subscribe
- Mute
- Subscribe to RSS Feed
- Permalink
- Report Inappropriate Content
Please show the complete "crash" message.
- Mark as New
- Bookmark
- Subscribe
- Mute
- Subscribe to RSS Feed
- Permalink
- Report Inappropriate Content
Thank you for your time.
The model has many loops. In versions compiled with CompaqFortran works fine.
The same code compiled in VisualStudio / Intel Parallels begins to fill both memory pools from the start and crashed proportionally to duration of the model run and size of the area.
In debug mode following message is given at the end:
'prevaf_fews_ifc.exe' (Win32): Loaded '\\wsl.ch\fe\gebhyd\3_Hyv\projekte\10years_glarus\08_Tools\src_prevah_if\prevaf_fews_ifc\prevaf_fews_ifc\Debug\prevaf_fews_ifc.exe'. Symbols loaded.
'prevaf_fews_ifc.exe' (Win32): Loaded 'C:\Windows\SysWOW64\ntdll.dll'. Cannot find or open the PDB file.
'prevaf_fews_ifc.exe' (Win32): Loaded 'C:\Windows\SysWOW64\kernel32.dll'. Cannot find or open the PDB file.
'prevaf_fews_ifc.exe' (Win32): Loaded 'C:\Windows\SysWOW64\KernelBase.dll'. Cannot find or open the PDB file.
'prevaf_fews_ifc.exe' (Win32): Loaded 'C:\Windows\SysWOW64\imagehlp.dll'. Cannot find or open the PDB file.
'prevaf_fews_ifc.exe' (Win32): Loaded 'C:\Windows\SysWOW64\msvcrt.dll'. Cannot find or open the PDB file.
The program '[6684] prevaf_fews_ifc.exe' has exited with code 0 (0x0).
Short experiments work fine.
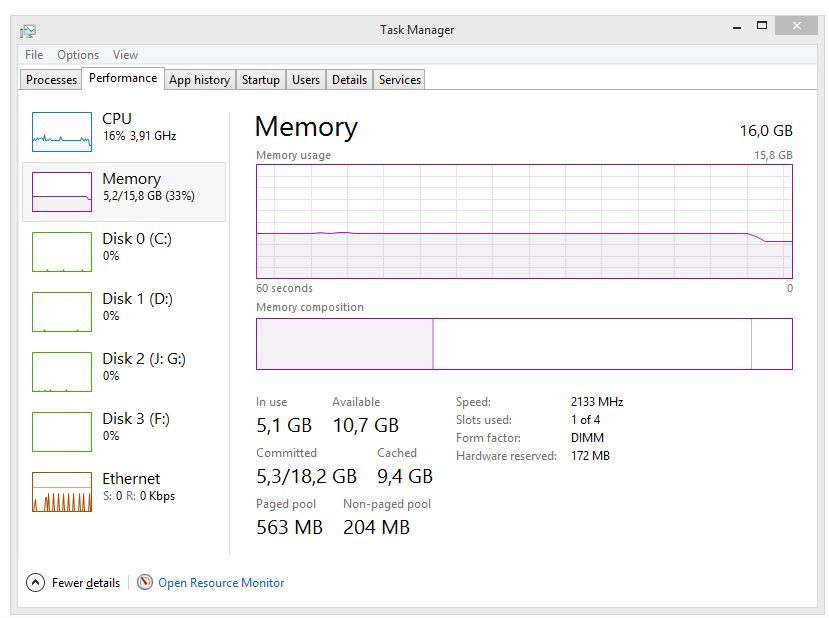
Here also the print-screen just after the crash that finally frees the memory
Thanks
Massimiliano
- Mark as New
- Bookmark
- Subscribe
- Mute
- Subscribe to RSS Feed
- Permalink
- Report Inappropriate Content
The messages from the debug mode are at most annoying - they only indicate that you cannot debug the various system DLLs that are loaded. As the program itself stop with error code 0 and no stack trace or whatever, I would hazard to say it runs fine.
That conclusion is possibly wrong, but the information you give us does not indicate anything useful.
How do you know there is a problem?
- Mark as New
- Bookmark
- Subscribe
- Mute
- Subscribe to RSS Feed
- Permalink
- Report Inappropriate Content
I know that there is a problem because:
- the version with previous compiler works
- if i start my job 1 year later then he finds the file he is not finding when I start the job earlier.
- if i comment out the core of the model, then everything runs, all files are found, but no calculation is done
- if I monitor the memory of windows during the job, then the problem arises always at about 2.7 GB non-pooled memory. if I monitor the model run with old compiler, then the non pooled memory stays the whole time at about 210 MB.
i would expect that I have to check some options in the VS2013 project to obtain an executable without the problem. But I have no clue ...
Bests
Massimiliano
- Mark as New
- Bookmark
- Subscribe
- Mute
- Subscribe to RSS Feed
- Permalink
- Report Inappropriate Content
Is it Parallel Studio XE 2016 Update 1 or latter? The original 2016 leaked windows handles.....
- Mark as New
- Bookmark
- Subscribe
- Mute
- Subscribe to RSS Feed
- Permalink
- Report Inappropriate Content
- Mark as New
- Bookmark
- Subscribe
- Mute
- Subscribe to RSS Feed
- Permalink
- Report Inappropriate Content
It is update 4
Thanks for your comment
- Mark as New
- Bookmark
- Subscribe
- Mute
- Subscribe to RSS Feed
- Permalink
- Report Inappropriate Content
Intel Inspector XE can track memory growth and identify leaks. You can get a 30-day free trial if you don't already have the Professional or Cluster edition of Parallel Studio XE.
As Arjen says, the messages from the debugger show normal termination. Could it be that the input file isn't where the program expects it? Remember that when run from Visual Studio, the default directory is the project directory, not the one with the EXE.
- Mark as New
- Bookmark
- Subscribe
- Mute
- Subscribe to RSS Feed
- Permalink
- Report Inappropriate Content
Thanks again for your help.
I both confgured to run from Visual Studio and from my usual test framework (copied the EXE where the working old version is).
I get identical behaviour of the code. Files are there, the old version finds them.
Will have a look at the Inspector, thanks.
Bests
Massimiliano
BTW, same code runs also on linux with no problems.
- Subscribe to RSS Feed
- Mark Topic as New
- Mark Topic as Read
- Float this Topic for Current User
- Bookmark
- Subscribe
- Printer Friendly Page
