- Mark as New
- Bookmark
- Subscribe
- Mute
- Subscribe to RSS Feed
- Permalink
- Report Inappropriate Content
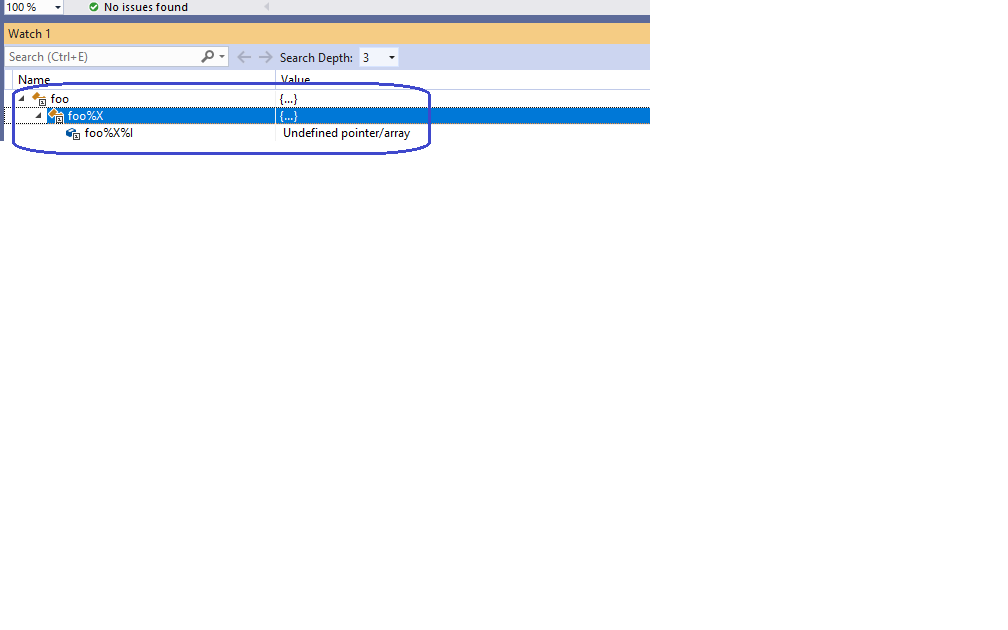
For a while now I have been unable to interrogate the contents of allocatable variables, that are declared within a user defined data type, the MS Visual Studio debugger. Screen grab below shows an example data structure used to store IGES CAD data entries to illustrate this:

There is no problem with the actual data as the program continues normally even though the Watch Window claims that the allocatable arrays are 'Undefined pointer/arrays'
I don't remember exactly when this fault was introduced. I do recall that it did used to be possible to interrogate these types of variables back in 2015/16 I guess. I am aware that other posts have been made on this subject in the past so I am wondering if Intel have:
a) identified where the problem lies and who is responsible for fixing it MS or Intel?
b) are still actively trying to find a solution
c) have any idea when/if it will ever be resolved
With each new release of either VS or FORTRAN compilers I look to see if this problem has been resolved only to be disappointed each time.
I reported this to Intel Premier Support a few years ago but the case simply went cold with no resolution.
My current work round involves copying the allocated data to a local copy (outside of the TYPE construct) where I can interrogate the allocated arrays with no problem. This approach can get tedious and I don't want to have special debug code clogging up the sources so I would rather avoid having to do this.
If I am missing a trick somewhere I am open to any suggestions.
Thanks
- Mark as New
- Bookmark
- Subscribe
- Mute
- Subscribe to RSS Feed
- Permalink
- Report Inappropriate Content
Fix will be available in the upcoming oneAPI 2021.2 update release.
Link Copied
- Mark as New
- Bookmark
- Subscribe
- Mute
- Subscribe to RSS Feed
- Permalink
- Report Inappropriate Content
Unfortunately, you're unlikely to get an answer here. I recommend asking for status again in your support case.
- Mark as New
- Bookmark
- Subscribe
- Mute
- Subscribe to RSS Feed
- Permalink
- Report Inappropriate Content
See this thread for another workaround you can consider for this issue.
Over the years, I've submitted many service requests toward debugging support of components of derived types with ALLOCATABLE attributes but to no avail. I do currently have an open incident at Intel OSC where the Intel support response suggests a possible fix in the near future but there is no indication as to the scope and timing of the resolution.
As advised, it'll be very useful if you too can submit a support ticket of the issues you face - more customer service requests with Intel the better the chances of some progress on this longstanding issue.
Thanks,
- Mark as New
- Bookmark
- Subscribe
- Mute
- Subscribe to RSS Feed
- Permalink
- Report Inappropriate Content
Any and all readers considering Intel Parallel Studio product on Windows with integration of Intel Fortran compiler with Visual Studio for debugging support should take note of this.
Consider the following trivial code that I claim conforms to Fortran 95 standard (a language revision that was published over 2 decades ago):
module m
   type :: t
      integer, allocatable :: i(:)
   end type
end module
module n
   use m, only : t
   type :: u
      type(t) :: x
   end type
end module
   use n, only : u
   type(u) :: foo
   foo%x%i = (/ 1, 2, 3 /)
   stop
end
Support toward debugging such simple code that was possible with Digital Visual Fortran (DEC) and Visual Studio 6.0 way back nearly 20 years ago is not possible with current Intel Parallel Studio with any supported version of Visual Studio e.g., VS2017 or VS2019.
See below where I show a side-by-side screenshot comparison of current use of Compaq Visual Fortran v6.6 and Visual Studio 6.0 on a Windows 10 workstation with latest Intel Parallel Studio 2020 Update 2 with Visual Studio 2019 v16.6.4. The dreaded "Undefined pointer/array" can be seen with latest Intel Parallel Studio in the Locals window whereas the correct values can be viewed with the decades old software.

It is really, really shameful the issue arose in the first place with Intel Fortran integration with Visual Studio (yeah I've read all the excuses but don't buy any of them considering how much amateur and inexperienced developers are able to offer as extensions to Visual Studio in the online marketplace for free) but it's beyond unconscionable the problem has persisted for so long in a commercial product.
The team I work with subscribes to several licenses of Intel Parallel Studio and pays a hefty amount of support each year, but now the few remaining users of Fortran and their program leads and budget managers are indescribably unhappy and can't move away fast enough from Fortran. The lack of debugging support by Intel Fortran in Visual Studio toward ALLOCATABLE components of derived types, which is among the few advantageous features of Fortran, severely impacts productivity and this deficiency has seriously hurt the value of Intel Parallel Studio product.
- Mark as New
- Bookmark
- Subscribe
- Mute
- Subscribe to RSS Feed
- Permalink
- Report Inappropriate Content
Interesting, I only started using derived types with allocatable components in recent years and I just assumed the debugger problems were part of the catch-up with "new features". I hadn't appreciated it was was such a longstanding problem and indeed a regression compared to some of the forerunners of IVF. I was expecting it to get fixed in due course but now I think that might be a naive assumption!
I will file a ticket on an example of my issues.
- Mark as New
- Bookmark
- Subscribe
- Mute
- Subscribe to RSS Feed
- Permalink
- Report Inappropriate Content
Thanks Fortran Fan for the example, was it as long ago as CVF the last time that this worked? There also used to be a useful feature called Array Viewer though that long since disappeared as well. How time flies, anyway it could be that long as I have been using this product through various guises since 1996. Not bad for a "Beginner"! though to be fair I don't regard myself as a programmer, more of an engineer/analyst who uses programs to try to make life easier.
Anyway, I too have submitted this issue (again) to Intel Product Support. Hopefully it will kick start something though I am not holding my breath!
My frustration is not helped by the "Tell us what you think" pop-ups that keep interrupting you whilst you are trying to type. They don't really let you actually tell anyone what you think either, just what they want to hear in order to justify some daft policy someone has decided upon, probably some sort of cost cutting exercise. I fear for the future of FORTRAN if this decline in standards carries on.
Rant over (this is what 12 weeks of lockdown does to you!)
I will update the post in the unlikely event that I get a positive response.
- Mark as New
- Bookmark
- Subscribe
- Mute
- Subscribe to RSS Feed
- Permalink
- Report Inappropriate Content

No further comment.
- Mark as New
- Bookmark
- Subscribe
- Mute
- Subscribe to RSS Feed
- Permalink
- Report Inappropriate Content
Just a quick update. I submitted a ticket to Intel Support back in July. After a few exchanges with the engineer, who initially claimed this had already been fixed, I convinced him that it hadn't by providing a simple reproducer (attached), and consequently the problem has finally been recognised as a bug in the Fortran Expression Evaluator and given a case number DOQG-1964. So there is a chance that it might now get fixed in a forthcoming release. We can only hope that it is sooner rather than later.
I will keep everyone posted with any further updates.
Steve
- Mark as New
- Bookmark
- Subscribe
- Mute
- Subscribe to RSS Feed
- Permalink
- Report Inappropriate Content
It's not just allocatable arrays in derived types. I randomly see strange debug behaviour in any array. It varies between compiles rather than between runs. Arrays appear in 4 possible states:
1. Correct size and contents. (rarely for allocatable arrays)
2. Zero size but element zero contains element 1 (most often case). Seams like its expecting a c style array.
3. Randomly incorrect size including huge values that crash the debugger.
4. Eroneous report of unallocated state.
Random debugger crashes also crash visual studio.
So now I can only debug by pepering the code with console outputs. Like others, I am actively seaking a way out of Fortran since I dont konw of any other supplier offering modern Fortran with an IDE.
- Mark as New
- Bookmark
- Subscribe
- Mute
- Subscribe to RSS Feed
- Permalink
- Report Inappropriate Content
I have just updated my compiler to 19.1.0057.16 and can confirm that the bug is still here.
I am tempted to revert back to the 2017 version.
We really need a fix for that.
- Mark as New
- Bookmark
- Subscribe
- Mute
- Subscribe to RSS Feed
- Permalink
- Report Inappropriate Content
@NsK ,
If you are able to, please submit a support request providing your details and stating your case forcefully at the Intel Online Support Center: https://supporttickets.intel.com/?lang=en-US. More customer requests the better.
- Mark as New
- Bookmark
- Subscribe
- Mute
- Subscribe to RSS Feed
- Permalink
- Report Inappropriate Content
just curious, do you have /recursive in your compiler options in the configuration?
- Mark as New
- Bookmark
- Subscribe
- Mute
- Subscribe to RSS Feed
- Permalink
- Report Inappropriate Content
I don't believe so.
The compiler options I used for the reproducer were:
/nologo /debug:full /Od /warn:interfaces /module:"x64\Debug\\" /object:"x64\Debug\\" /Fd"x64\Debug\vc160.pdb" /traceback /check:bounds /check:stack /libs:dll /threads /dbglibs /c
Full solution for reproducer attached.
- Mark as New
- Bookmark
- Subscribe
- Mute
- Subscribe to RSS Feed
- Permalink
- Report Inappropriate Content
@Ron_Green I confirm that /recursive is off. This issue is not present with XE 2019 19.0.0048.15 - even pointers to those nested types are displayed flawlessly in that version! - I've got a feeling it might have gone fubar after XE 2019 update 4 (GNU* Debugger updated to version 8.2.1)...
- Mark as New
- Bookmark
- Subscribe
- Mute
- Subscribe to RSS Feed
- Permalink
- Report Inappropriate Content
Just an update, I have opened a support ticket and was told the issue has been escalated with higher priority.
Fingers crossed.
- Mark as New
- Bookmark
- Subscribe
- Mute
- Subscribe to RSS Feed
- Permalink
- Report Inappropriate Content
Just tried latest update. Unfortunately the issue covered in this thread (case number DOQG-1964) remains unresolved. There seems to be a typo in the really extensive Release Notes which states:
Changes in Update 4 (Intel® Fortran Compiler 19.1.3)
- Corrections to reported problems.
I reckon they should really say:
"Corrections to some reported problems"
Hopefully next time something will be done about this.
Many contributors on this forum try to help improve the product by providing reproducer examples to illustrate flaws within the software that we or our employers have all paid good money to use. Creating reproducer examples can often take several man hours to produce and test so the least I would expect from Intel are some updates from time to time explaining where any particular case is in the pecking order. This would be much more preferable to being simply ignored.
The last time I had any response from anyone at Intel was back in August.
- Mark as New
- Bookmark
- Subscribe
- Mute
- Subscribe to RSS Feed
- Permalink
- Report Inappropriate Content
@Stephen_Sutcliffe I had a reply from Devorah on the 21st telling me that the issue was not fixed yet.
Fair enough, it's totally understandable that they might not have the resources to work on our first-world problem at the moment.
Still, somehow, it feels like Intel has given up on Fortran lately...
- Mark as New
- Bookmark
- Subscribe
- Mute
- Subscribe to RSS Feed
- Permalink
- Report Inappropriate Content
One of our admins tried Intel oneAPI Beta10 i.e., Intel Fortran v2021.1.1 on one of the test workstations using the simple test case I showed above.
Unfortunately the problem remains even in that latest effort
- Mark as New
- Bookmark
- Subscribe
- Mute
- Subscribe to RSS Feed
- Permalink
- Report Inappropriate Content
Speaking as a former insider, there are three things that make fixing this kind of debug issue hard:
- The Microsoft DST (Debug Symbol Table) format is aimed at C/C++, and Fortran semantics have to be worked in around the edges
- The way that the Fortran debug expression evaluator is called by Visual Studio places some limits on what it can do
- Development and support of the Fortran expression evaluator is not handled by the compiler team, but by a separate team outside the US.
I don't know which mix of these make this a difficult problem to solve, but I am sure it is not as simple as it sounds. If the problem is ultimately Microsoft's, I can pretty much guarantee it will never get fixed (MS has historically been deaf to requests from the Intel Fortran team.) Also, problems such as this that don't prevent you from running the application tend to have lower priority. As always, I suggest periodic requests for updates in the ticket system, not here.
- Mark as New
- Bookmark
- Subscribe
- Mute
- Subscribe to RSS Feed
- Permalink
- Report Inappropriate Content
@Steve_Lionel as usual, thanks for the intel.
It's depressing that the same limitations are present in GDB (and don't even get me started on its handling of arrays...).
In terms of debugging capabilities, has anyone here tested the NVIDIA HPC SDK?
- Mark as New
- Bookmark
- Subscribe
- Mute
- Subscribe to RSS Feed
- Permalink
- Report Inappropriate Content
@FortranFan please share the case# or attach a reproducer.
- Subscribe to RSS Feed
- Mark Topic as New
- Mark Topic as Read
- Float this Topic for Current User
- Bookmark
- Subscribe
- Printer Friendly Page