- Mark as New
- Bookmark
- Subscribe
- Mute
- Subscribe to RSS Feed
- Permalink
- Report Inappropriate Content
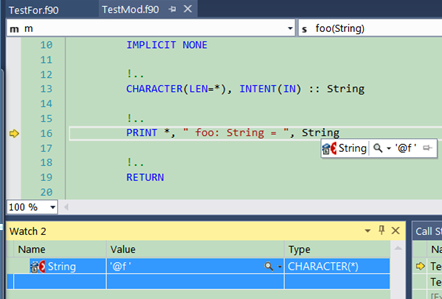
Consider the simple code shown below. The debugger hover and watch functionality in Visual Studio doesn't show the correct value for the assumed-length CHARACTER dummy argument when the actual argument has the ALLOCATABLE attribute. I'm using Intel Fortran Compiler 15, Update 1. But I think the problem is present in compiler 15, initial release too.
   MODULE m

      !..
      IMPLICIT NONE

   CONTAINS

      SUBROUTINE foo(String)

         IMPLICIT NONE

         !..
         CHARACTER(LEN=*), INTENT(IN) :: String

         !..
         PRINT *, " foo: String = ", String

         !..
         RETURN

      END SUBROUTINE foo

   END MODULE m

   PROGRAM p

      USE m, ONLY : foo

      IMPLICIT NONE

      !..
      CHARACTER(LEN=:), ALLOCATABLE :: s

      !..
      s = "Hello World!"

      CALL foo(s)

      !..
      STOP

   END PROGRAM p
Is this a known issue? Any fix for this?
Link Copied
- Mark as New
- Bookmark
- Subscribe
- Mute
- Subscribe to RSS Feed
- Permalink
- Report Inappropriate Content
Sorry, I should have checked before suggesting the issue may be due to the actual argument having an ALLOCATABLE attribute; the problem exists if the actual is a fixed length string too.
- Mark as New
- Bookmark
- Subscribe
- Mute
- Subscribe to RSS Feed
- Permalink
- Report Inappropriate Content
I am not seeing this with the IPS XE 2015 initial release so I will try with the Update 1 and post again soon.
- Mark as New
- Bookmark
- Subscribe
- Mute
- Subscribe to RSS Feed
- Permalink
- Report Inappropriate Content
Kevin,
Thanks for your follow-up. I think I noticed the problem with compiler 15 initial release also last week, but didn't get around to reporting it. Since then I've upgraded to Update 1, so I can't confirm.
Now it's possible the problem is on my end with something being amiss with the Intel Fortran integration with Visual Studio, given that it is an issue with such a simple thing that Intel's test procedures and/or other users would have already caught it. Are there any checks I can make on my setup (e.g., version numbers of certain DLLs fee.dll?) that may help figure out what is going on?
- Mark as New
- Bookmark
- Subscribe
- Mute
- Subscribe to RSS Feed
- Permalink
- Report Inappropriate Content
Under the MSVS IDE, under Help > About, click on the Intel Parallel Studio XE 2015 Composer Edition for Fortran Windows* to see the integration version details.
Prior to first installing that IPS XE 2015 from earlier, did you have the 14.0 or 13.1 compiler installed?
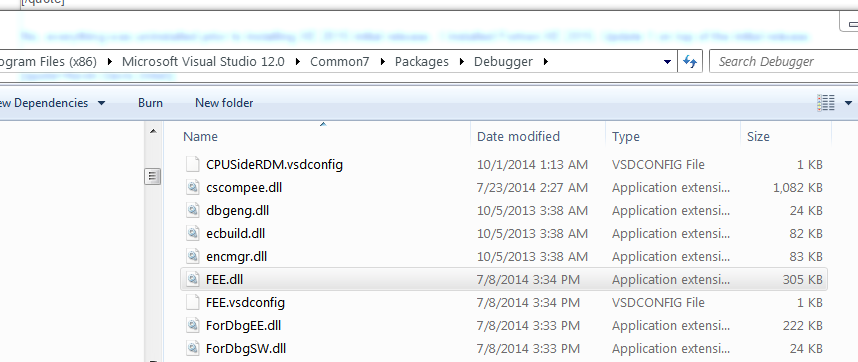
You can right-click on the file C:\Program Files (x86)\Microsoft Visual Studio 11.0\Common7\Packages\Debugger\FEE.dll and look at the details tab to see what version that is also.
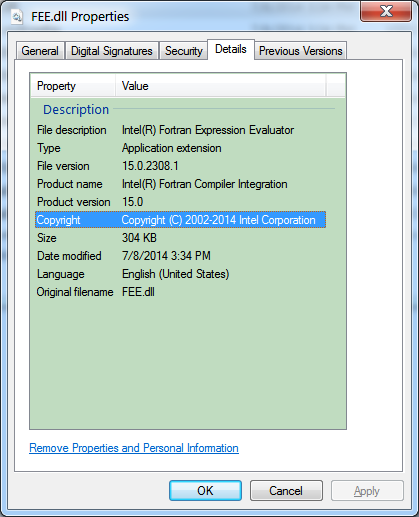
With IPS XE 2015 (initial), I’m showing the integration components under the IDE at Version 15.0.0107.12 and the FEE.dll version at 15.0.2308.1. I'll check those again under Update 1 once that's in place on another system.
- Mark as New
- Bookmark
- Subscribe
- Mute
- Subscribe to RSS Feed
- Permalink
- Report Inappropriate Content
Kevin Davis (Intel) wrote:
Under the MSVS IDE, under Help > About, click on the Intel Parallel Studio XE 2015 Composer Edition for Fortran Windows* to see the integration version details.
..
Here're the details for me:
Intel® Parallel Studio XE 2015 Composer Edition for Fortran Windows* Update 1 Integration
for Microsoft Visual Studio* 2013, Version 15.0.0115.12,
Copyright © 2002-2014 Intel Corporation. All rights reserved.
* Other names and brands may be claimed as the property of others.
Kevin Davis (Intel) wrote:
..
Prior to first installing that IPS XE 2015 from earlier, did you have the 14.0 or 13.1 compiler installed?
..
No, all previous Intel Fortran versions were uninstalled prior to installing XE 2015 initial release. I however installed Fortran XE 2015, Update 1 on top of the initial release.
Kevin Davis (Intel) wrote:
..
You can right-click on the file C:\Program Files (x86)\Microsoft Visual Studio 11.0\Common7\Packages\Debugger\FEE.dll and look at the details
..
Here're the fee.dll details:
- Mark as New
- Bookmark
- Subscribe
- Mute
- Subscribe to RSS Feed
- Permalink
- Report Inappropriate Content
Thanks for the added details. Unfortunately the problem is not reproducing with Update 1 either. I tried VS 2013 and 2012 with Update 1 and only VS 2013 earlier with the initial release. I will inquire with the IDE integration team about this.
What version of Visual Studio are you using?
- Mark as New
- Bookmark
- Subscribe
- Mute
- Subscribe to RSS Feed
- Permalink
- Report Inappropriate Content
Kevin,
I'm noticing the problem with both VS 2013, Update 4 as well as VS 2012, Update 4. However, VS 2010 SP1 seems to work fine. Note all 3 versions of VS are installed on the same computer and the same Intel Fortran Composer XE 2015, Update 1 version integrates with these VS versions.
Thanks,
- Mark as New
- Bookmark
- Subscribe
- Mute
- Subscribe to RSS Feed
- Permalink
- Report Inappropriate Content
At your convenience, could you zip up your small test case solution/project and attach it to this thread?
That will help eliminate any project settings we may have set differently.
- Mark as New
- Bookmark
- Subscribe
- Mute
- Subscribe to RSS Feed
- Permalink
- Report Inappropriate Content
Kevin Davis (Intel) wrote:
At your convenience, could you zip up your small test case solution/project and attach it to this thread?
That will help eliminate any project settings we may have set differently.
Kevin,
Here's a zip file of the test case. As I mentioned in Quote #8, the same exact solution file (test.sln) included in this zip has been tried with 3 different VS versions: VS 2013, Update4; VS 2012, Update 4; and VS 2010 SP1. The problem with debug watch and hover not working with CHARACTER(LEN=*) :: String dummy argument occurs with both VS 2013, Update 4 as well as VS 2012, Update 4. However, VS 2010 SP1 works fine. Note all 3 versions of VS are installed on the same computer and the same Intel Fortran Composer XE 2015, Update 1 version integrates with these VS versions.
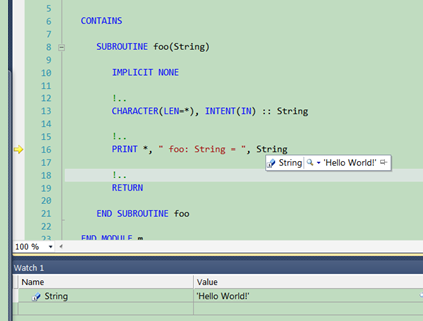
Here's a screen capture from VS2010, SP1: you can see how it compares with the image in the original post above.
- Mark as New
- Bookmark
- Subscribe
- Mute
- Subscribe to RSS Feed
- Permalink
- Report Inappropriate Content
This is indeed strange behavior. Thank you for the test case. It also behaves properly for me under VS 2010, 2012, 2013. I am soliciting help from the Debugger developers hoping they offer things we can have you look at to find the root of this behavior. I appreciate your patience.
- Mark as New
- Bookmark
- Subscribe
- Mute
- Subscribe to RSS Feed
- Permalink
- Report Inappropriate Content
Well, I just stumbled onto something interesting. With a breakpoint set at the SUBROUTINE FOO (or just using run to cursor), when execution stops at this statement I see a strange value for String and the type reported as CHARACTER(*). Worse is that this strange value persists when continuing execution deeper into FOO to the PRINT. I do not see this behavior with 2010.
Is it possible you may have run to the SUBROUTINE statement first before continuing to the PRINT?
I wonder if you will experience an incorrect value if running to the PRINT as the first execution under the debugger.
- Mark as New
- Bookmark
- Subscribe
- Mute
- Subscribe to RSS Feed
- Permalink
- Report Inappropriate Content
Kevin Davis (Intel) wrote:
Well, I just stumbled onto something interesting. With a breakpoint set at the SUBROUTINE FOO (or just using run to cursor), when execution stops at this statement I see a strange value for String and the type reported as CHARACTER(*). Worse is that this strange value persists when continuing execution deeper into FOO to the PRINT. I do not see this behavior with 2010.
Is it possible you may have run to the SUBROUTINE statement first before continuing to the PRINT?
I wonder if you will experience an incorrect value if running to the PRINT as the first execution under the debugger.
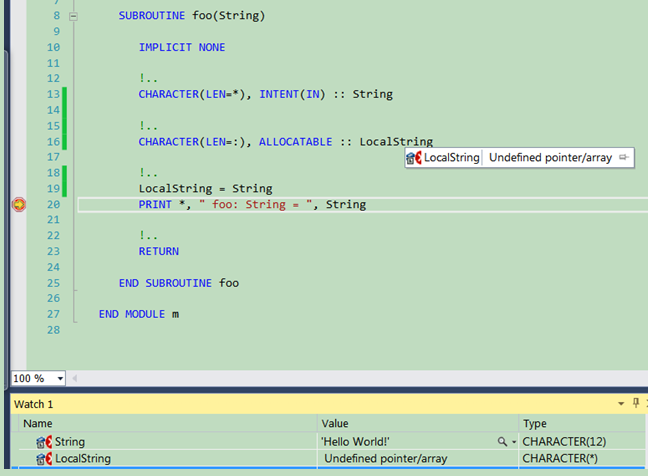
You got it, thanks! I was setting the breakpoint in the caller (program p in the MWE) and stepping into the module procedure and noticing the strange value. But if I do as you suggest i.e., set the breakpoint directly at the PRINT statement in FOO, then debug watch and hover for the dummy argument String works fine. However I've another problem too (which I should have mentioned originally but forgot) and which is this: a local variable of CHARACTER type with an ALLOCATABLE attribute is not handled by the debugger and it keeps showing up as "Undefined pointer/array". See a screen capture below and you can see the small code change therein. Can you please see if this is reproducible for you?
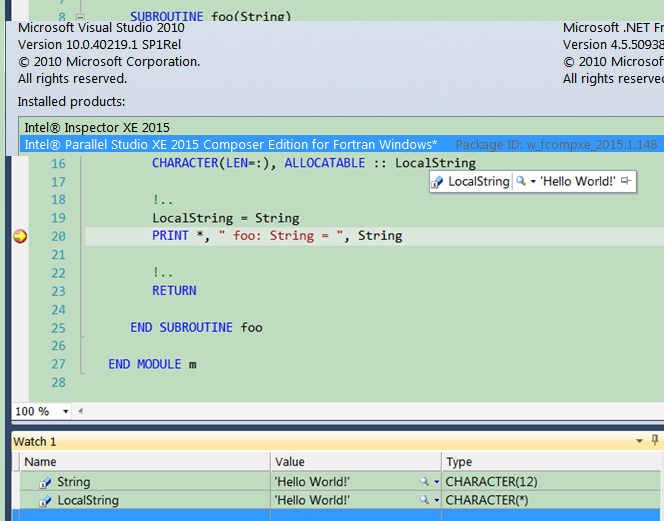
Now see below: when the same case is tried in VS 2010 SP1, the local variable is handled reasonably by the debugger [even though it would be nice if it showed up as CHARACTER(12) under Type also instead of CHARACTER(*)].
I assume the first issue i.e., debugger being unable to display correctly the dummy CHARACTER argument when one steps into the code is something you now acknowledge as a bug and you can follow up on that with the development team?
Thanks,
- Mark as New
- Bookmark
- Subscribe
- Mute
- Subscribe to RSS Feed
- Permalink
- Report Inappropriate Content
I have seen that type of behaviour in the past due memory getting corrupted by an unrelated problem. If I step into the sub I get one result but if I run to a breakpoint I get a different result. The corruption issue was interacting with and influencing the debugging. Horrible problem, I hope you do not have this.
- Mark as New
- Bookmark
- Subscribe
- Mute
- Subscribe to RSS Feed
- Permalink
- Report Inappropriate Content
app4619 wrote:
I have seen that type of behaviour in the past due memory getting corrupted by an unrelated problem. If I step into the sub I get one result but if I run to a breakpoint I get a different result. The corruption issue was interacting with and influencing the debugging. Horrible problem, I hope you do not have this.
Since I'm not noticing any issues with VS 2010 SP1, but with VS 2012 and 2013 when all 3 are run on the same machine with the same version of Intel Fortran Composer, I feel it is an integration issue with the latter VS versions unless these VS versions themselves are causing memory corruption.
- Mark as New
- Bookmark
- Subscribe
- Mute
- Subscribe to RSS Feed
- Permalink
- Report Inappropriate Content
Just a thought if you copy subroutine foo eg foo1 foo2 foo3 do all the foos exhibit the same problem?
- Mark as New
- Bookmark
- Subscribe
- Mute
- Subscribe to RSS Feed
- Permalink
- Report Inappropriate Content
app4619 - Interesting thought. After replicating foo as foo2 and foo3, only when entering foo does the corruption happen. String has a correct value when continuing execution and subsequently entering foo2 and foo3. I tried both variants where all foo routines used the symbol String and where each used a unique named dummy argument. Adding a fourth routine boo (which takes no arguments or one integer argument - the only two variants I tested) and entering it first leads to the correct value for assumed-length character dummy argument in all three foo routines entered subsequently (whether each’s dummy argument is identically or uniquely named). So it does appear there is a relation to entering the module scope for the first time where the routine entered first has an assumed-length character dummy argument.
FortranFan - Yes, I agree the behavior we replicated with assumed-length character dummy argument is a defect. I also replicated the good (under vs2010) and bad (under vs2013) behavior with the LocalString allocatable and agree that is another defect. I’ll provide internal tracking ids for both of these shortly. BTW, thanks for the screen snaps. Those are very helpful.
- Mark as New
- Bookmark
- Subscribe
- Mute
- Subscribe to RSS Feed
- Permalink
- Report Inappropriate Content
@Kevin: How do you debug a debugger? My mind has just gone into a recursive loop with no termination!
- Mark as New
- Bookmark
- Subscribe
- Mute
- Subscribe to RSS Feed
- Permalink
- Report Inappropriate Content
Kevin Davis (Intel) wrote:
.. So it does appear there is a relation to entering the module scope for the first time where the routine entered first has an assumed-length character dummy argument.
.. I’ll provide internal tracking ids for both of these shortly. BTW, thanks for the screen snaps. Those are very helpful.
Yes, very interesting thought by app4619. Hopefully that helps the development team with problem resolution.
Thanks much Kevin for your follow-up,
- Mark as New
- Bookmark
- Subscribe
- Mute
- Subscribe to RSS Feed
- Permalink
- Report Inappropriate Content
I submitted the two debugging issue to Development (see internal tracking ids below) and will provide updates as I hear more.
(Internal tracking id: DPD200363557 - Garbled value for assumed-length character dummy argument)
(Internal tracking id: DPD200363559 - Undefined pointer/array for local allocatable character variable)
@app4619 - Good question :-)
- Mark as New
- Bookmark
- Subscribe
- Mute
- Subscribe to RSS Feed
- Permalink
- Report Inappropriate Content
Any chance the two issues with tracking id's (DPD200363557 and DPD200363559) in this thread can get fixed in a release this year? These issues kinda hurt productivity while debugging in Visual Studio, so it will be a great help when they get resolved.
Thanks,
- Subscribe to RSS Feed
- Mark Topic as New
- Mark Topic as Read
- Float this Topic for Current User
- Bookmark
- Subscribe
- Printer Friendly Page
