- Mark as New
- Bookmark
- Subscribe
- Mute
- Subscribe to RSS Feed
- Permalink
- Report Inappropriate Content
Dear all,
I have the C++ dynamic linked library built by VS2012+Intel C++ 14.0, the dynamic linked library is called by Fortran main program.
Currently there are some problems in the C++ code and I need to locate it. However, the bug can't be reproduced in Debug mode but in Release mode, I can't get to know where the crash happened. I have set /Zi option in 'C/C++' and /DEBUG option in 'Linker', but the output message is as follows:
forrtl: severe (157): Program Exception - access violation
Image PC Routine Line Source
CSGlib.dll 000007FEEF57DF1E Unknown Unknown Unknown
CSGlib.dll 000007FEEF57DB5F Unknown Unknown Unknown
CSGlib.dll 000007FEEF57D78D Unknown Unknown Unknown
fem.exe 000000013FD6F26E ELEMENT_mp_LOCALM 20494 datatype.f90
fem.exe 000000013FDE82ED ELEMENT_mp_TESTME 20389 datatype.f90
fem.exe 000000013FF1DFEF LOGGING3D..0 4600 main.f90
fem.exe 000000013FEFE700 MAIN_PARALLEL 240 main.f90
fem.exe 000000013FE8C02D MAIN__ 39 main.f90
fem.exe 00000001429799B6 Unknown Unknown Unknown
fem.exe 0000000140950D88 Unknown Unknown Unknown
kernel32.dll 000000007775652D Unknown Unknown Unknown
ntdll.dll 000000007798C541 Unknown Unknown Unknown
where fem.exe is the Fortran main program and CSGlib.dll is the C++ dynamic linked library. I can get to know the crash location of Fortran code but can't get to know the location of C++ code.
What do I miss in project settings?
original post is here:
https://software.intel.com/en-us/forums/topic/517867
Thanks,
Zhanghong Tang
Link Copied
- Mark as New
- Bookmark
- Subscribe
- Mute
- Subscribe to RSS Feed
- Permalink
- Report Inappropriate Content
Progress: I tried to check the PDB files generated by the command
DUMPBIN /HEADERS fem.pdb
and
DUMPBIN /HEADERS csglib.pdb
The following errors displayed:
Microsoft (R) COFF/PE Dumper Version 11.00.61030.0
Copyright (C) Microsoft Corporation. All rights reserved.
Dump of file fem.pdb
fem.pdb : warning LNK4048: Invalid format file; ignored
Summary
Microsoft (R) COFF/PE Dumper Version 11.00.61030.0
Copyright (C) Microsoft Corporation. All rights reserved.
Dump of file csglib.pdb
csglib.pdb : warning LNK4048: Invalid format file; ignored
Summary
What settings should I add to generate valid format files?
Thanks
- Mark as New
- Bookmark
- Subscribe
- Mute
- Subscribe to RSS Feed
- Permalink
- Report Inappropriate Content
Dumpbin (as far as I am aware) does not read PDB files - hence the errors you see in your follow up post.
Try specifying the /traceback option for the C++ compiler when you build the DLL. That, plus /Zi, should give a reasonably specific location.
- Mark as New
- Bookmark
- Subscribe
- Mute
- Subscribe to RSS Feed
- Permalink
- Report Inappropriate Content
Hi IanH,
Thank you very much for your kindly reply. I have already specified the options /traceback and /Zi, but the output message still didn't give the location that crash happened in C++ code.
Is there anything that I missed?
Thanks
- Mark as New
- Bookmark
- Subscribe
- Mute
- Subscribe to RSS Feed
- Permalink
- Report Inappropriate Content
What other options are you using when you compile the DLL?
An example that works for me:
// crash-c.cpp
#include <cstdlib>

void c_two();
void c_three();

extern "C" void __declspec(dllexport) c_one()
{
  c_two();
}

void c_two()
{
  c_three();
}

void c_three()
{
  char *p = NULL;
  *p = 1;  // boom
}
! crash-fortran.f90
PROGRAM Crash
  IMPLICIT NONE
  CALL f_one
CONTAINS
  SUBROUTINE f_one()
    CALL f_two
  END SUBROUTINE f_one

  SUBROUTINE f_two()
    CALL f_three
  END SUBROUTINE f_two

  SUBROUTINE f_three()
    INTERFACE
      SUBROUTINE c_one() BIND(C,NAME='c_one')
        IMPLICIT NONE
      END SUBROUTINE c_one
    END INTERFACE
    CALL c_one
  END SUBROUTINE f_three
END PROGRAM Crash
>icl /LD /traceback /Zi "crash-c.cpp"
...
>ifort /traceback /Zi "crash-fortran.f90" "crash-c.lib"
...
>crash-fortran.exe
forrtl: severe (157): Program Exception - access violation
Image              PC                Routine            Line        Source
crash-c.dll        000007FEF6031040  ?c_three@@YAXXZ            19  crash-c.cpp
crash-c.dll        000007FEF6031024  ?c_two@@YAXXZ              13  crash-c.cpp
crash-c.dll        000007FEF603100F  c_one                       8  crash-c.cpp
crash-fortran.exe  000000013F4E1062  CRASH_ip_F_THREE           19  crash-fortran.f90
crash-fortran.exe  000000013F4E104D  CRASH_ip_F_TWO             10  crash-fortran.f90
crash-fortran.exe  000000013F4E1038  CRASH_ip_F_ONE              6  crash-fortran.f90
crash-fortran.exe  000000013F4E101E  MAIN__                      3  crash-fortran.f90
crash-fortran.exe  000000013F57EFCE  Unknown               Unknown  Unknown
crash-fortran.exe  000000013F556173  Unknown               Unknown  Unknown
kernel32.dll       00000000770559ED  Unknown               Unknown  Unknown
ntdll.dll          000000007718C541  Unknown               Unknown  Unknown
- Mark as New
- Bookmark
- Subscribe
- Mute
- Subscribe to RSS Feed
- Permalink
- Report Inappropriate Content
- Mark as New
- Bookmark
- Subscribe
- Mute
- Subscribe to RSS Feed
- Permalink
- Report Inappropriate Content
- Mark as New
- Bookmark
- Subscribe
- Mute
- Subscribe to RSS Feed
- Permalink
- Report Inappropriate Content
Hello Zhanghong,
Thanks for posting crashtest.zip. Let me do some debugging, and I'll follow up here. Since this seems more like a Fortran issue than C++ issue, I will close the original post https://software.intel.com/en-us/forums/topic/517867 on the C++ Forum.
Patrick
- Mark as New
- Bookmark
- Subscribe
- Mute
- Subscribe to RSS Feed
- Permalink
- Report Inappropriate Content
Dear Patrick,
Thank you very much for your kindly reply.
Are there any wrong settings in my project?
Thanks
- Mark as New
- Bookmark
- Subscribe
- Mute
- Subscribe to RSS Feed
- Permalink
- Report Inappropriate Content
Dear IanH,
How to build a x64 version DLL by command line?
I tried to test your example by
icl /LD /traceback /Zi /MACHINE:X64 "crash-c.cpp"
but the compiler displayed the following error:
icl: command line warning #10006: ignoring unknown option '/MACHINE:X64'
Thanks
IanH wrote:
What other options are you using when you compile the DLL?
An example that works for me:
// crash-c.cpp
#include <cstdlib>

void c_two();
void c_three();

extern "C" void __declspec(dllexport) c_one()
{
  c_two();
}

void c_two()
{
  c_three();
}

void c_three()
{
  char *p = NULL;
  *p = 1;  // boom
}
! crash-fortran.f90
PROGRAM Crash
  IMPLICIT NONE
  CALL f_one
CONTAINS
  SUBROUTINE f_one()
    CALL f_two
  END SUBROUTINE f_one

  SUBROUTINE f_two()
    CALL f_three
  END SUBROUTINE f_two

  SUBROUTINE f_three()
    INTERFACE
      SUBROUTINE c_one() BIND(C,NAME='c_one')
        IMPLICIT NONE
      END SUBROUTINE c_one
    END INTERFACE
    CALL c_one
  END SUBROUTINE f_three
END PROGRAM Crash
>icl /LD /traceback /Zi "crash-c.cpp" ... >ifort /traceback /Zi "crash-fortran.f90" "crash-c.lib" ... >crash-fortran.exe forrtl: severe (157): Program Exception - access violation Image PC Routine Line Source crash-c.dll 000007FEF6031040 ?c_three@@YAXXZ 19 crash-c.cpp crash-c.dll 000007FEF6031024 ?c_two@@YAXXZ 13 crash-c.cpp crash-c.dll 000007FEF603100F c_one 8 crash-c.cpp crash-fortran.exe 000000013F4E1062 CRASH_ip_F_THREE 19 crash-fortran.f90 crash-fortran.exe 000000013F4E104D CRASH_ip_F_TWO 10 crash-fortran.f90 crash-fortran.exe 000000013F4E1038 CRASH_ip_F_ONE 6 crash-fortran.f90 crash-fortran.exe 000000013F4E101E MAIN__ 3 crash-fortran.f90 crash-fortran.exe 000000013F57EFCE Unknown Unknown Unknown crash-fortran.exe 000000013F556173 Unknown Unknown Unknown kernel32.dll 00000000770559ED Unknown Unknown Unknown ntdll.dll 000000007718C541 Unknown Unknown Unknown
- Mark as New
- Bookmark
- Subscribe
- Mute
- Subscribe to RSS Feed
- Permalink
- Report Inappropriate Content
You need to use the proper command window (one which is configured to use IFort-x64), by choosing a command window shortcut with a name similar to "Intel 64 Visual Studio 2012 mode", under Intel Parallel Studio in the program menu.
Within that window, IanH's commands will work fine. You used the incorrect option /MACHINE:X64 in your command line. First of all, that is an option to the librarian (LIB) and linker (LINK) commands, not the compiler. Secondly, if you use the proper command window, this option is unnecessary.
- Mark as New
- Bookmark
- Subscribe
- Mute
- Subscribe to RSS Feed
- Permalink
- Report Inappropriate Content
I do not know if this is pertinent or not.
When building a Release build from Visual Studio .AND. adding compiler options for debug line numbers (and likely traceback) the compiler will produce that information.
However, the Link options for Release build default to strip off all debug information.
In VS Solution property page for Linker, Debugging, set Generate Debug Info to Yes (/DEBUG)
Jim Dempsey
- Mark as New
- Bookmark
- Subscribe
- Mute
- Subscribe to RSS Feed
- Permalink
- Report Inappropriate Content
Dear mecej4,
Thank you very much for your kindly reply.
I have already used that window, but the built DLL of my own program is wrong. I don't know why...
- Mark as New
- Bookmark
- Subscribe
- Mute
- Subscribe to RSS Feed
- Permalink
- Report Inappropriate Content
Dear Jim,
Thank you very much for your kindly reply. I have already set that option as you said, but it seems that only Debug version shows the error information correctly.
Thanks
jimdempseyatthecove wrote:
I do not know if this is pertinent or not.
When building a Release build from Visual Studio .AND. adding compiler options for debug line numbers (and likely traceback) the compiler will produce that information.
However, the Link options for Release build default to strip off all debug information.
In VS Solution property page for Linker, Debugging, set Generate Debug Info to Yes (/DEBUG)
Jim Dempsey
- Mark as New
- Bookmark
- Subscribe
- Mute
- Subscribe to RSS Feed
- Permalink
- Report Inappropriate Content
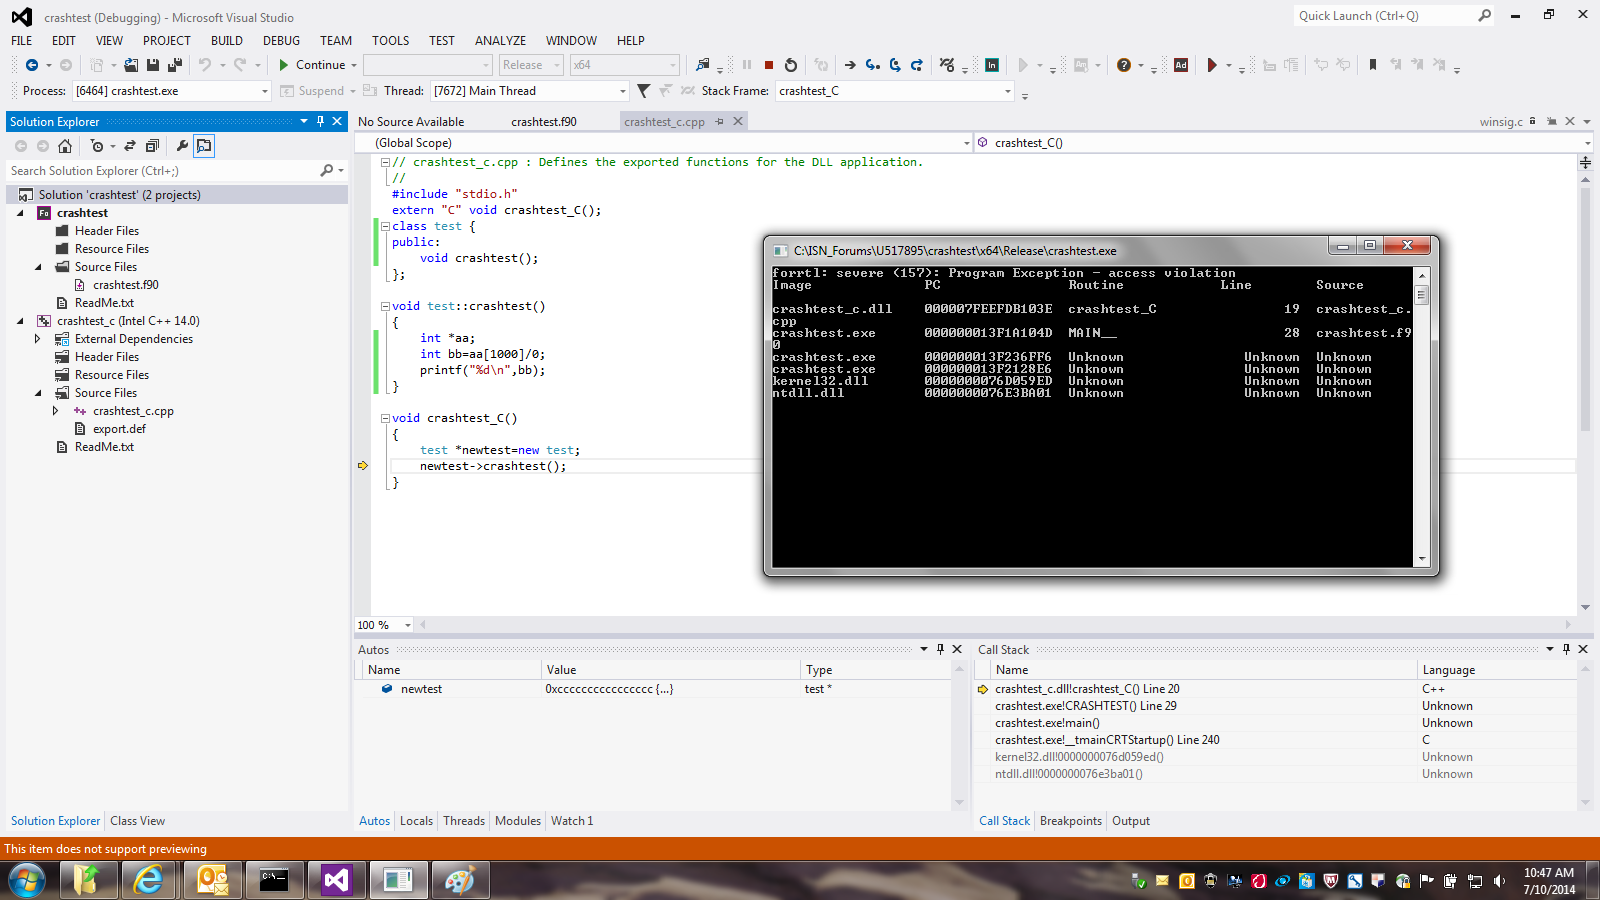
Hello Zhanghong,
You said "only Debug version shows the error information correctly." Do you get any error information? When I build in Release mode, then do Debug > Start Debugging, I get trigger a breakpoint on newtest->crashtest(); That's not quite what I expected, but I do get a traceback (see attached).
As an aside, for simple coding errors like divide-by-zero, you should just be using Debug mode to track them down. It's can be much harder in Release mode, due to inlining, loop optimsations, etc.
Patrick
- Mark as New
- Bookmark
- Subscribe
- Mute
- Subscribe to RSS Feed
- Permalink
- Report Inappropriate Content
Just to emphasize what I said in my last post, you can trigger a breakpoint in the Release build on the actual divide-by-zero by disabling inlining in the DLL (Properties > C/C++ > Optimization > Inline Function Expansion > Disabled (/Ob0).
Patrick
- Mark as New
- Bookmark
- Subscribe
- Mute
- Subscribe to RSS Feed
- Permalink
- Report Inappropriate Content
Dear Patrick,
Thank you very much for your kindly reply.
I just use the divide-by-zero to reproduce the crash problem and show that the crash problem can't be located in Release mode. I don't know what and where the crash problem is in my real code (the crash only happens in Release mode).
The option /Ob0 has successfully located the crash lines, but it still can't locate the crash location in my real program.
On the other hand, I also tried to test the command line by IanH, it can also locate the crash lines for the example without the option /Ob0.
Thanks
- Mark as New
- Bookmark
- Subscribe
- Mute
- Subscribe to RSS Feed
- Permalink
- Report Inappropriate Content
Dear Patrick and Jim,
I also tried to build my own project in command line as follows:
icl /D "TETLIBRARY" /D "CARVE_USE_EXACT_PREDICATES" /D "CARVE_SYSTEM_BOOST" /D "CARVE" /D "WIN64" /D "NDEBUG" /D "_WINDOWS" /I".\CSGlib\mesh" /I".\CSGlib\mesh\include" /I"C:\Program Files (x86)\boost_1_54_0" /I"C:\Program Files (x86)\Intel\VTune Amplifier XE 2013\include" ".\CSGlib\*.cpp" ".\CSGlib\mesh\*.cxx" ".\CSGlib\mesh\lib\*.cpp" ".\CSGlib\mesh\common\*.cpp" ".\CSGlib\mesh\external\src\*.cpp" /LD /bigobj /traceback /fp:precise /Zc:wchar_t /Zi /O2 /MT /EHsc /Fo.\obj\ /Fe:"Z:\directional\for_debug\CSGlib.dll" /Fd:"Z:\directional\for_debug\CSGlib.pdb" /F10000000000
After successfully built, I run the executable (still built from VS2012 IDE), the following error message displayed:
fem.exe - Application Error
The application was unable to start correctly (0x000007b). Click OK to close the application.
Is there any missed options I have not added?
Thanks
- Mark as New
- Bookmark
- Subscribe
- Mute
- Subscribe to RSS Feed
- Permalink
- Report Inappropriate Content
Try cutting back the pre-allocation size of the stack:
change /F10000000000 to something a bit smaller, and see if your executable will start up.
- Mark as New
- Bookmark
- Subscribe
- Mute
- Subscribe to RSS Feed
- Permalink
- Report Inappropriate Content
Dear Lorri,
Thank you very much for your kindly reply. I also noticed that and I changed it to /F1000000000, the problem is solved.
Currently I can locate the problem by running my real program built from command line.
Thanks
- Subscribe to RSS Feed
- Mark Topic as New
- Mark Topic as Read
- Float this Topic for Current User
- Bookmark
- Subscribe
- Printer Friendly Page