- Mark as New
- Bookmark
- Subscribe
- Mute
- Subscribe to RSS Feed
- Permalink
- Report Inappropriate Content
Hello dear experts
Just upgraded to OneAPI + Fortran from the old Composer XE 2013 and need to perform some profiling. (Visual Studio 2022, Windows)
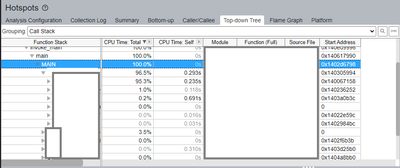
VTune Profiler detects hotspots and shows the time percentage for every function.
However, it does not show the Function call count, only the time percentage:
The time spent in the function is not very informative without knowing how many times this function was called.
In the old 2013 Intel Fortran we had this compiler option:
/Qprofile-functions:all
and it generated a nice report about ALL function call counts, time, loops etc.
Now the new ifort help does not show this option.
When trying to compile with it says:
ifort: command line warning #10157: ignoring option '/Qprofile-loops'; argument is of wrong type
Wondering what is the way now to get the function call counts.
Thanks.
Ivan.
- Tags:
- profiler
- Mark as New
- Bookmark
- Subscribe
- Mute
- Subscribe to RSS Feed
- Permalink
- Report Inappropriate Content
the Advisor tool has call counts. Scroll down THIS THREAD to the 2nd to the last post. It also drills down to loop-level for hot loops, trip counts. I find it more user friendly than Vtune, which is designed for micro-architecture details (too low level for me).
Link Copied
- Mark as New
- Bookmark
- Subscribe
- Mute
- Subscribe to RSS Feed
- Permalink
- Report Inappropriate Content
the Advisor tool has call counts. Scroll down THIS THREAD to the 2nd to the last post. It also drills down to loop-level for hot loops, trip counts. I find it more user friendly than Vtune, which is designed for micro-architecture details (too low level for me).
- Mark as New
- Bookmark
- Subscribe
- Mute
- Subscribe to RSS Feed
- Permalink
- Report Inappropriate Content
Thanks for the reply!
It truly works!
Do you know by any chance why i need to check "FLOP", otherwise function call count won't show up? I thought FLOP is floating-point operations. Looks irrelevant for function call count, but it works...
- Mark as New
- Bookmark
- Subscribe
- Mute
- Subscribe to RSS Feed
- Permalink
- Report Inappropriate Content
the Advisor team put it as part of Flop counts. They didn't want yet another collection type. Too confusing when there are too many collection options - look at Vtune for example. Their thinking was the FLOP collection is already doing deep profiling so adding function call counts was super easy to do at the same time.
- Mark as New
- Bookmark
- Subscribe
- Mute
- Subscribe to RSS Feed
- Permalink
- Report Inappropriate Content
- Subscribe to RSS Feed
- Mark Topic as New
- Mark Topic as Read
- Float this Topic for Current User
- Bookmark
- Subscribe
- Printer Friendly Page
