- Mark as New
- Bookmark
- Subscribe
- Mute
- Subscribe to RSS Feed
- Permalink
- Report Inappropriate Content
Hello,
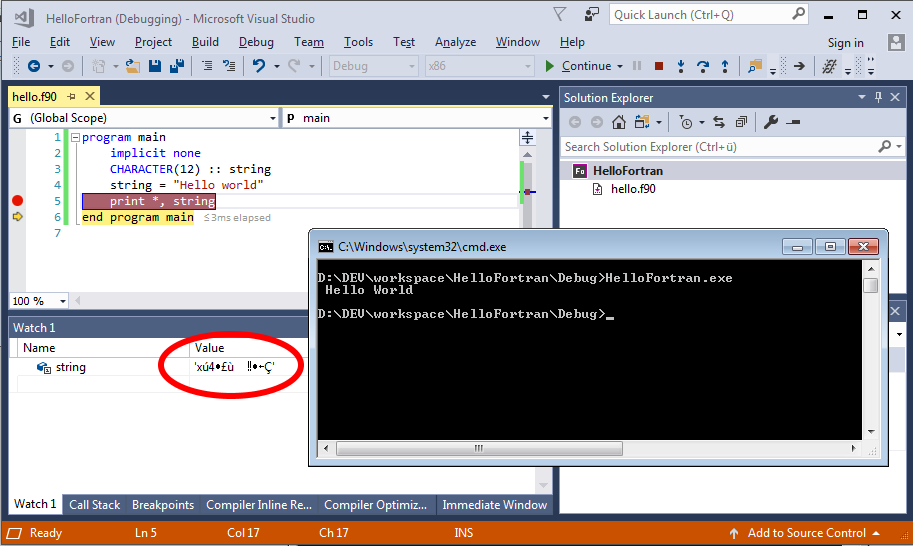
I just upgraded from Visual Studio 2008 and Intel Visual Fortran Compiler 11 to Visual Studio 2017 and Visual Fortran 2018. The program compiles and runs just fine, but while debugging, the content of character (string) variables is always shown as garbled text. See the screenshot for a very simple example. It seems like an encoding issue? Is there some setting that I am missing?
- Mark as New
- Bookmark
- Subscribe
- Mute
- Subscribe to RSS Feed
- Permalink
- Report Inappropriate Content
In general, it is tough to debug code that has also been optimized. Statements are not necessarily executed in sequence, some variables may exist only in registers, and the debugger has only a somewhat fuzzy view of what is going on. Once in a while, we have a bug that goes alive only with optimization turned on, and it is tough to tackle such bugs using a symbolic debugger.
For the toy code that you showed, the individual letters of the string are pushed to their proper locations on the stack in a non-sequential order. The complete string is never assembled in such a way that the debugger can show it in the variables pane.
Link Copied
- Mark as New
- Bookmark
- Subscribe
- Mute
- Subscribe to RSS Feed
- Permalink
- Report Inappropriate Content
I see a couple of things off here. One is that you ran the program from the command prompt, and it looks as if the debugger thinks it is looking at a C program as the variable name is in lowercase. Your command window hides the Type information in the debugger window so I can't be sure. Also, I can reproduce "garbage" characters only if I enable optimization.
How did you build the application and how did you get the debugger to start if you ran it from the command line?
- Mark as New
- Bookmark
- Subscribe
- Mute
- Subscribe to RSS Feed
- Permalink
- Report Inappropriate Content
It's a console application, so when I tell the debugger to start, it launches the console.
You are right about the optimization. Disabling optimization produces the proper strings. Thanks a lot!
- Mark as New
- Bookmark
- Subscribe
- Mute
- Subscribe to RSS Feed
- Permalink
- Report Inappropriate Content
Starting the application in the debugger opens a console window, but NOT a command prompt window. That command prompt window you show is, I think, from running the program separately.
- Mark as New
- Bookmark
- Subscribe
- Mute
- Subscribe to RSS Feed
- Permalink
- Report Inappropriate Content
In general, it is tough to debug code that has also been optimized. Statements are not necessarily executed in sequence, some variables may exist only in registers, and the debugger has only a somewhat fuzzy view of what is going on. Once in a while, we have a bug that goes alive only with optimization turned on, and it is tough to tackle such bugs using a symbolic debugger.
For the toy code that you showed, the individual letters of the string are pushed to their proper locations on the stack in a non-sequential order. The complete string is never assembled in such a way that the debugger can show it in the variables pane.
- Mark as New
- Bookmark
- Subscribe
- Mute
- Subscribe to RSS Feed
- Permalink
- Report Inappropriate Content
Steve Lionel (Ret.) wrote:
Starting the application in the debugger opens a console window, but NOT a command prompt window. That command prompt window you show is, I think, from running the program separately.
I didn't know that there is a difference between the two. But I definitely started the application through the debugger and that is the window that popped up.
- Mark as New
- Bookmark
- Subscribe
- Mute
- Subscribe to RSS Feed
- Permalink
- Report Inappropriate Content
I think you are mistaken.
- Mark as New
- Bookmark
- Subscribe
- Mute
- Subscribe to RSS Feed
- Permalink
- Report Inappropriate Content
Felix F. wrote:
I didn't know that there is a difference between the two. But I definitely started the application through the debugger and that is the window that popped up.
In your screen grab it clearly shows your application was started by entering the exe name on the command line as opposed to hitting F5 (or the start debug menu options) in Visual studio.
- Mark as New
- Bookmark
- Subscribe
- Mute
- Subscribe to RSS Feed
- Permalink
- Report Inappropriate Content
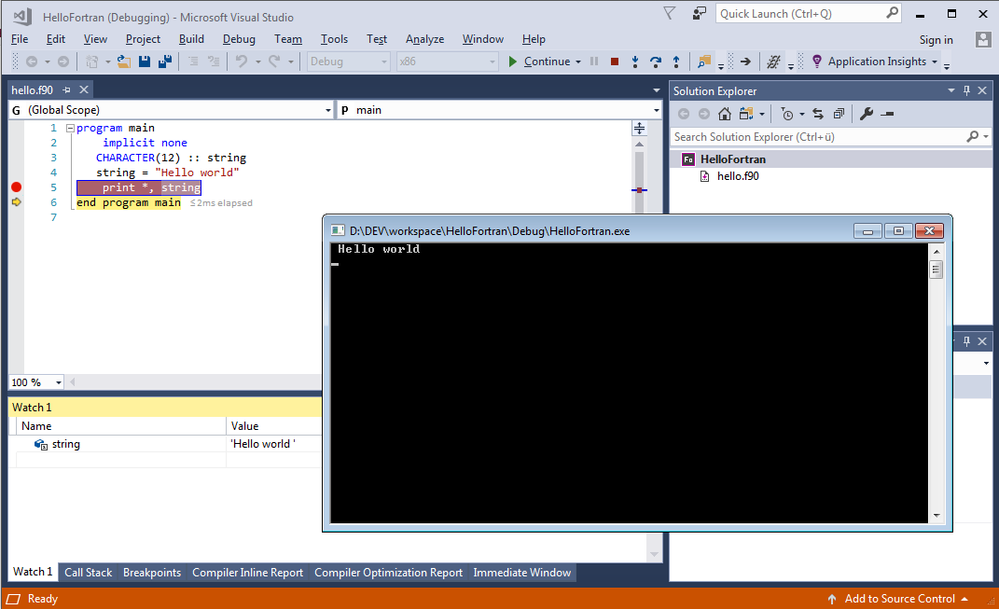
Right, my apologies. I must have screencapped the wrong window, which I had used for testing earlier. My intent was to show that the console output is "Hello world" while the debugger is showing garbled text.
Here is a new screencap with the console that actually pops up when I start the debugger. The contents of the string variable are now legible in the watch window as I have switched off optimization, thanks to your very helpful replies. Sorry for causing confusion about the console / command prompt.
- Subscribe to RSS Feed
- Mark Topic as New
- Mark Topic as Read
- Float this Topic for Current User
- Bookmark
- Subscribe
- Printer Friendly Page

