- Mark as New
- Bookmark
- Subscribe
- Mute
- Subscribe to RSS Feed
- Permalink
- Report Inappropriate Content
I was using GPA 2019r3 fine for a while now, but recently updated to the newest version for the shader profiling features. After the update, capturing the exact same executable produce unusable result.
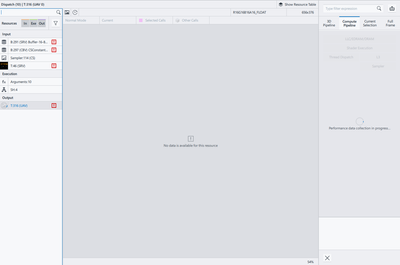
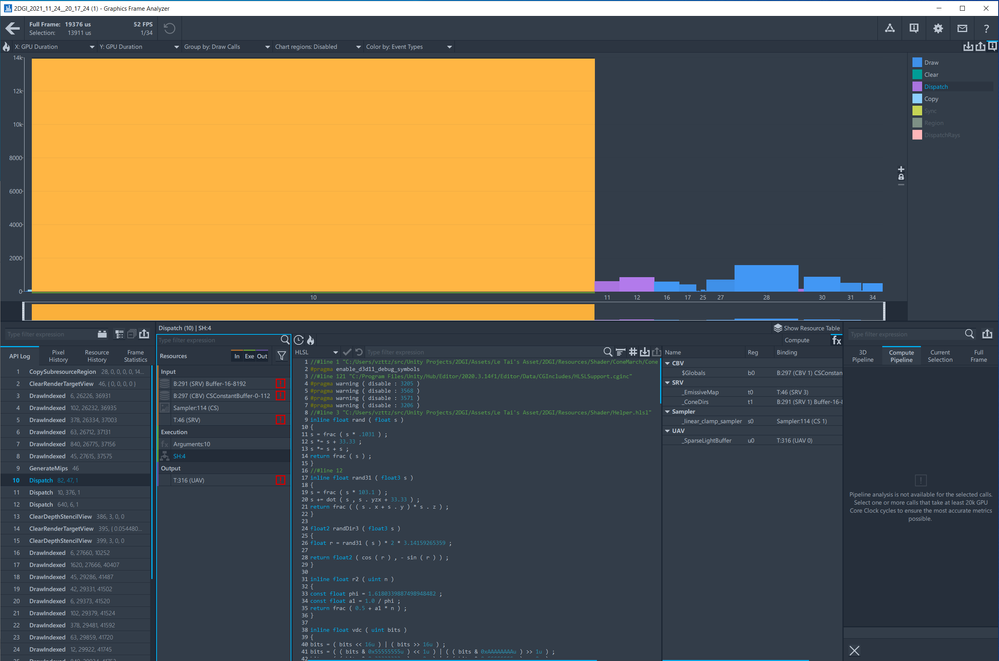
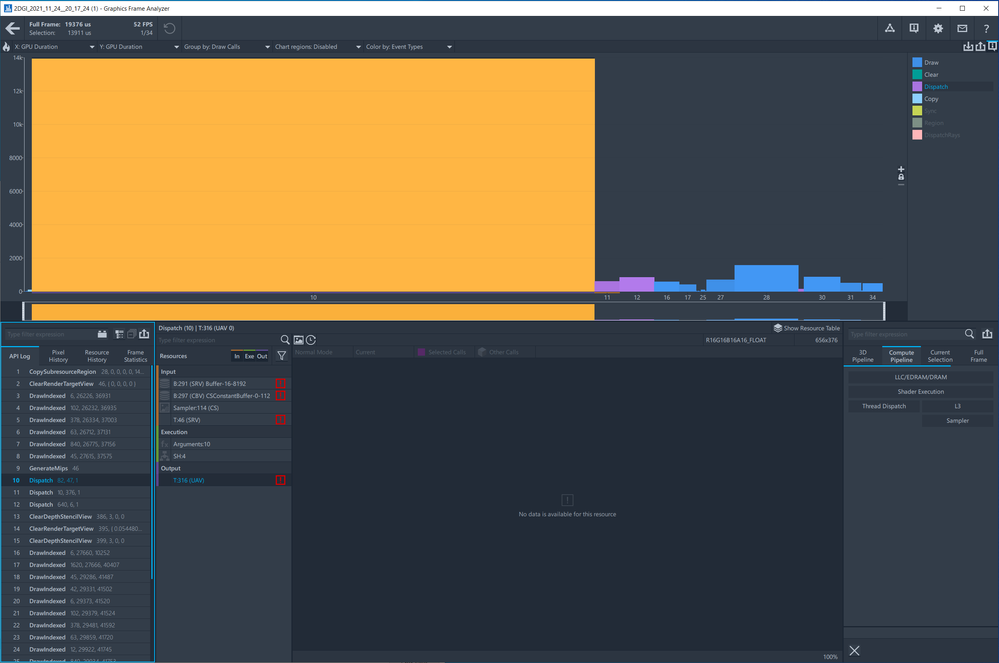
Clicking on any draw call does not show any information, it just say "Performance data collection in progress..." forever:
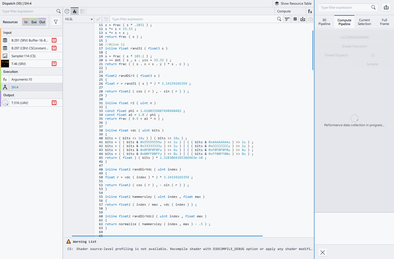
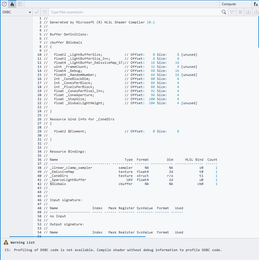
Amusingly, the shader profiler feature also act weirdly to me: If I choose HLSL, it say I need to compile with debug information, despite I clearly did. If I choose DXBC on the exact same draw call, it say I need to compile without debug information.
These issues does not happen if I rebuilt for DX12, but DX12 is not well supported by my engine and cause many other problems.
This is my frame info. I can privately send the capture and executable if required.
File Name: 2DGI_2021_11_24__20_17_24
App Name: 2DGI.exe
API: DirectX 11.2
Resolution: 1280x720
Device: TaiDESKTOP
Capture GPU: Intel(R) UHD Graphics 630 (0x3E98)
Playback GPU: Intel(R) UHD Graphics 630
Frame Number: 1407

Capture/Playback System Information
Operating System:
    Name: Windows 10 Version 2009 (OS Build 19044.1348)
    Locale: en-US
    Windows Developer Mode is enabled
    Secure Boot/Trusted Boot is disabled

CPU Information:
    Architecture: x64
    Cores count: 6

System BIOS:
    Version: American Megatrends Inc. P4.10
    Date: 05/07/2019

GPU Information:
    Name: Intel(R) UHD Graphics 630
    Vendor id: 0x8086
    Product id: 0x3E98
    Stepping: 2
    Driver Version: 30.0.101.1069
    Driver Date: 11-2-2021

Machine:
    Name: TaiDESKTOP
    Memory: 16040 MB
    Screen: 2560x1440, 32 bit

Graphics Performance Analyzers:
    Version: 21.3.1632323082
    Commit hash: b5b99390
Link Copied
- Mark as New
- Bookmark
- Subscribe
- Mute
- Subscribe to RSS Feed
- Permalink
- Report Inappropriate Content
Leloctai,
Yes, please send me the frame capture. There is a direct message option at the top right of the window. Click on your profile pic.
Pamela
- Mark as New
- Bookmark
- Subscribe
- Mute
- Subscribe to RSS Feed
- Permalink
- Report Inappropriate Content
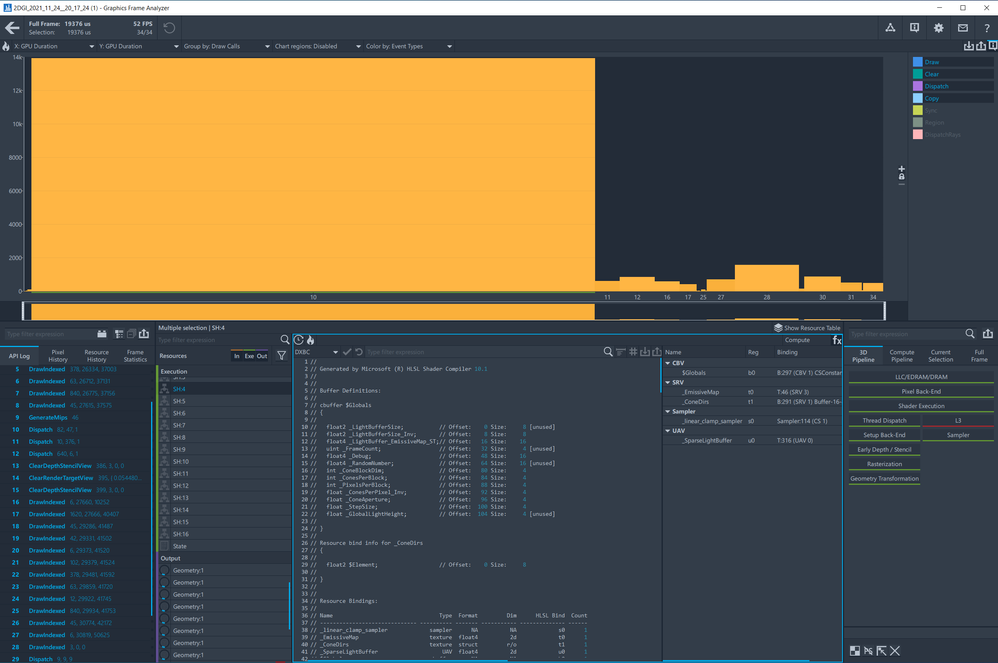
Thanks for responding. I've sent the frame capture. I should note that the capture look fine when first opened up, but the problems appear upon clicking any event. Event 10, the one that took the most time, is the one that contains the shader with debug information that I shown in the original post.
- Mark as New
- Bookmark
- Subscribe
- Mute
- Subscribe to RSS Feed
- Permalink
- Report Inappropriate Content
Leloctai,
I took a look at your frame. Funny, I wouldn't have been able to reproduce your issue if I hadn't just gotten a new computer and hadn't yet enabled Developer Mode. I saw the shader profiler messages you saw too, but not after enabling Dev Mode.
So now that I have enabled Dev Mode, I no longer have the issues you found. Do you have Developer Mode enabled for Windows?
Pamela
- Mark as New
- Bookmark
- Subscribe
- Mute
- Subscribe to RSS Feed
- Permalink
- Report Inappropriate Content
I have Dev Mode enabled. You can see that and more details in my first message. I tried toggling dev mode off and on but that also doesn't help. Maybe it's something about the particular version of Windows and Drivers? Here's the details again:
File Name: 2DGI_2021_11_24__20_17_24
App Name: 2DGI.exe
API: DirectX 11.2
Resolution: 1280x720
Device: TaiDESKTOP
Capture GPU: Intel(R) UHD Graphics 630 (0x3E98)
Playback GPU: Intel(R) UHD Graphics 630
Frame Number: 1407

Capture/Playback System Information
Operating System:
    Name: Windows 10 Version 2009 (OS Build 19044.1348)
    Locale: en-US
    Windows Developer Mode is enabled
    Secure Boot/Trusted Boot is disabled

CPU Information:
    Architecture: x64
    Cores count: 6

System BIOS:
    Version: American Megatrends Inc. P4.10
    Date: 05/07/2019

GPU Information:
    Name: Intel(R) UHD Graphics 630
    Vendor id: 0x8086
    Product id: 0x3E98
    Stepping: 2
    Driver Version: 30.0.101.1069
    Driver Date: 11-2-2021

Machine:
    Name: TaiDESKTOP
    Memory: 16040 MB
    Screen: 2560x1440, 32 bit

Graphics Performance Analyzers:
    Version: 21.3.1632323082
    Commit hash: b5b99390
- Mark as New
- Bookmark
- Subscribe
- Mute
- Subscribe to RSS Feed
- Permalink
- Report Inappropriate Content
Oh right, you already provided that info.
So, I was using a pre-release 21.4 version of GPA. I've reverted back to the public 21.3.
With 21.3 - the version you are using:
- Now the Output Geometry never finalizes. It's got the infinite circle. Fig 1
- As for the shader warning - I don't see that at all anymore. Fig 2
- I have a lot of "No Data Available". Fig 3
We're running on similar platforms.
File Name: 2DGI_2021_11_24__20_17_24 (1)
App Name: 2DGI.exe
API: DirectX 11.2
Resolution: 1280x720
Device: TaiDESKTOP
Capture GPU: Intel(R) UHD Graphics 630 (0x3E98)
Playback GPU: Intel(R) UHD Graphics
Frame Number: 1407
Capture System Information
Operating System:
Name: Windows 10 Version 2009 (OS Build 19044.1348)
Locale: en-US
Windows Developer Mode is enabled
Secure Boot/Trusted Boot is disabled
CPU Information:
Architecture: x64
Cores count: 6
System BIOS:
Version: American Megatrends Inc. P4.10
Date: 05/07/2019
GPU Information:
Name: Intel(R) UHD Graphics 630
Vendor id: 0x8086
Product id: 0x3E98
Stepping: 2
Driver Version: 30.0.101.1069
Driver Date: 11-2-2021
Machine:
Name: TaiDESKTOP
Memory: 16040 MB
Screen: 2560x1440, 32 bit
Graphics Performance Analyzers:
Version: 21.3.1632323082
Commit hash: b5b99390
Playback System Information
Operating System:
Name: Windows 10 Version 2009 (OS Build 19042.1348)
Locale: en-US
Windows Developer Mode is enabled
Secure Boot/Trusted Boot is disabled
CPU Information:
Architecture: x64
Cores count: 8
System BIOS:
Version: HP S73 Ver. 01.06.01
Date: 08/05/2021
GPU Information:
Name: Intel(R) UHD Graphics
Vendor id: 0x8086
Product id: 0x9B41
Stepping: 2
Driver Version: 30.0.100.9955
Driver Date: 10-7-2021
Machine:
Name: pamelaha-mobl1
Memory: 32541 MB
Screen: 1920x1080, 32 bit
Graphics Performance Analyzers:
Version: 21.3.1632323082
Commit hash: b5b99390
Did you try getting more captures? Or a stream?
Pamela
- Mark as New
- Bookmark
- Subscribe
- Mute
- Subscribe to RSS Feed
- Permalink
- Report Inappropriate Content
I also got a lot of the no data available message. I did tried capture again many time, both with the stream and frame option.
One thing to note is this exact binary work fine with GPA 2019r3. I did update the GPU driver when updating GPA, as with older driver do not seem to support the shader profiling features, which is the reason I updated GPA for. Unfortunately I did not remember the old driver version, but I 90% sure frame capture did load when I used that older driver.
If the pre-release version works, is it available for the public anywhere, or will it soon?
- Mark as New
- Bookmark
- Subscribe
- Mute
- Subscribe to RSS Feed
- Permalink
- Report Inappropriate Content
Okay.
The pre-release is not available publicly, but it will be our Q4 release - coming out this month.
Another option . . . you can try capturing with GPA Framework. It's the backend for Frame Analyzer. It's a separate download on our download page. It's command line.
Meanwhile, I will hand off your frame to the dev team so they can take a look to see why there was a regression in this case.
Pamela
- Subscribe to RSS Feed
- Mark Topic as New
- Mark Topic as Read
- Float this Topic for Current User
- Bookmark
- Subscribe
- Printer Friendly Page
