- Mark as New
- Bookmark
- Subscribe
- Mute
- Subscribe to RSS Feed
- Permalink
- Report Inappropriate Content
When running a benchmark which compares SSE optimized code with AVX2 optimized code I'm getting results for the AVX2 optimized code with a very strong deviation:
Run on (1 X 2300 MHz CPU )
11/16/16 17:57:45
Color printing is only supported for stdout on windows. Disabling color printing
Benchmark                                         Time           CPU Iterations
-------------------------------------------------------------------------------
SSE64BitAligned1To1/Copy/1024                   357 ns        361 ns    1947826
SSE64BitAligned1To1/Copy/1024                   357 ns        353 ns    1947826
SSE64BitAligned1To1/Copy/1024                   358 ns        353 ns    1947826
SSE64BitAligned1To1/Copy/1024                   358 ns        361 ns    1947826
SSE64BitAligned1To1/Copy/1024                   298 ns        297 ns    1947826
SSE64BitAligned1To1/Copy/1024                   298 ns        305 ns    1947826
SSE64BitAligned1To1/Copy/1024                   300 ns        297 ns    1947826
SSE64BitAligned1To1/Copy/1024                   299 ns        305 ns    1947826
SSE64BitAligned1To1/Copy/1024                   298 ns        297 ns    1947826
SSE64BitAligned1To1/Copy/1024                   298 ns        297 ns    1947826
SSE64BitAligned1To1/Copy/1024_mean              322 ns        322 ns    1947826
SSE64BitAligned1To1/Copy/1024_stddev             29 ns         28 ns          0
AUTOVEC64BitAligned1To1/Copy/1024               760 ns        753 ns    1120000
AUTOVEC64BitAligned1To1/Copy/1024               760 ns        767 ns    1120000 <-- worst case
AUTOVEC64BitAligned1To1/Copy/1024               758 ns        753 ns    1120000
AUTOVEC64BitAligned1To1/Copy/1024               604 ns        614 ns    1120000
AUTOVEC64BitAligned1To1/Copy/1024               139 ns        140 ns    1120000 <-- best case
AUTOVEC64BitAligned1To1/Copy/1024               282 ns        279 ns    1120000
AUTOVEC64BitAligned1To1/Copy/1024               282 ns        293 ns    1120000
AUTOVEC64BitAligned1To1/Copy/1024               179 ns        181 ns    1120000
AUTOVEC64BitAligned1To1/Copy/1024               179 ns        181 ns    1120000
AUTOVEC64BitAligned1To1/Copy/1024               180 ns        181 ns    1120000
AUTOVEC64BitAligned1To1/Copy/1024_mean          412 ns        414 ns    1120000
AUTOVEC64BitAligned1To1/Copy/1024_stddev        259 ns        258 ns          0
CPU: Intel(R) Xeon(R) CPU E5-2650 v3 @ 2.30 GHz
The above example shows the exact same benchmark on SSE optimized code (SSE64BitAligned1To1) compared to AVX2 optimized code (AUTOVEC64BitAligned1To1) while the SSE results are relatively stable the AVX2 optimized code runs more than 2 times slower in the worst case.
Is there a way to make sure the AVX code does never run slower than SSE optimized code?
Best,
Lars Kleen
- Tags:
- Intel® Advanced Vector Extensions (Intel® AVX)
- Intel® Streaming SIMD Extensions
- Parallel Computing
- Mark as New
- Bookmark
- Subscribe
- Mute
- Subscribe to RSS Feed
- Permalink
- Report Inappropriate Content
More notes:
- You usually need 32-byte-aligned data to get full performance on Haswell processors.
- For Loads:
- The L1 Data Cache can service two loads/cycle (any size) if neither load crosses a cache-line boundary, but can only service one load/cycle if that load crosses a cache-line boundary.
- For 32-Byte loads, this means that you need 32-Byte alignment to prevent every other load from crossing a cache-line boundary.
- For the unaligned 32-Byte load case, you can improve performance by manually re-ordering the loads from two cache lines so that the two loads from the lower half of each line are adjacent (and can execute in one cycle) while the loads from the upper half of each cache line take one cycle each.
- I have never seen the compiler do this transformation.
- The fact that the manual re-ordering improves the performance from 4 cycles (for 2 lines) to 3 cycles (for 2 lines) proves that the hardware out-of-order mechanism does not handle this automagically.
- The 1/2-speed obtained with unaligned loads is not a large penalty in the real world, so the compiler does not work terribly hard to ensure that loads are 32-byte-aligned (on Haswell and newer processors). It will do it if it is easy, but if it involves creating multiple code paths for the same loop lengths it looks like it opts for the unaligned loads with a single code path instead.
- The L1 Data Cache can service two loads/cycle (any size) if neither load crosses a cache-line boundary, but can only service one load/cycle if that load crosses a cache-line boundary.
- For Stores
- The penalty for unaligned stores is much worse than the penalty for loads, so the compiler will work very hard to avoid them.
- In this case (one store in the loop) that is quite easy, but the compiler can deal with this in several ways.
- The "#pragma vector aligned" may not mean what you think it means.
- According to the Intel 17 C++ compiler manual, this pragma "instructs the compiler to use aligned data movement instructions for all array references when vectorizing".
- This means that the compiler will not generate multiple versions of the loop to avoid stores that cross cache-line boundaries.
- So if you pass a destination pointer that is not 32-Byte-aligned, you will be crossing cache-line-boundaries on every other store, and performance will drop. (I don't know the size of the penalty for stores, but you need to look at both the penalty for stores that cross a cache line boundary and stores that cross a 4KiB page boundary -- the latter may be large enough to be important even though it happens only once per 64 lines.)
- The penalty for unaligned stores is much worse than the penalty for loads, so the compiler will work very hard to avoid them.
Any low-level benchmark of this type really needs performance counter support for validation. Lots of the counter events are broken, but there are still plenty of useful ones that could be used here. On Haswell I would start with these 8 (that can all be measured at once if HyperThreading is disabled, otherwise it will take two runs):
- MISALIGN_MEM_REF.LOADS
- MISALIGN_MEM_REF.STORES
- LD_BLOCKS_PARTIAL.ADDRESS_ALIAS ---> slowdown if dst has too many bits in common with src
- CPU_CLK_UNHALTED.THREAD_P
- L1D.REPLACEMENT ---> just to be sure data is really coming from L1
- INST_RETIRED.ANY_P
- MEM_UOPS_RETIRED.ALL_LOADS
- MEM_LOAD_UOPS_RETIRED.L1_HIT
These should be run with the process pinned to a single logical processor and the frequency pinned to a fixed value.
The overhead of reading 8 counters using the RDPMC instruction is likely to be 200-300 cycles, so I would experiment with different measurement granularity -- reading the counters for every call to the "copy1to1" routine, every 2 calls, every 4 calls, ... every 128 calls.
Notes:
- It is CRITICAL to ensure that the data pages that you will use to hold the counter values are instantiated before use --- a page fault when you go to write a counter value to memory will really mess up any subsequent counter reads.
- It is very helpful to pay attention to the "footprint" of the counter values that you are saving so that these don't overflow the L1 Data Cache. The code under test is using 1/2 of the L1 Data Cache, so I would recommend performing a small enough number of measurements that you don't expect to use more than 1/4 of the L1 Data Cache to hold the counter values. You should write zeros to these memory locations immediately before you begin executing a sequence of tests, so that when you store the counter values, you get L1 Data Cache hits.
Link Copied
- Mark as New
- Bookmark
- Subscribe
- Mute
- Subscribe to RSS Feed
- Permalink
- Report Inappropriate Content
Show your code.
Jim Dempsey
- Mark as New
- Bookmark
- Subscribe
- Mute
- Subscribe to RSS Feed
- Permalink
- Report Inappropriate Content
This looks like the "256-bit startup" behavior on Haswell....
Haswell's 256-bit pipelines are split into two independent 128-bit pipelines. By default one of these pipelines is powered off -- I call this the "upper" pipeline, but the nomenclature is arbitrary.
When the "upper" pipeline is powered off and you start using instructions that involve 256-bit registers, the instructions are executed in an "emulation mode" using the lower pipeline. "Emulation mode" runs at about 1/4 speed -- one cycle to execute the instruction on the bits in the "lower" half of the register and 3 cycles to transfer the bits from the "upper" half of the register to the "lower" pipeline to execute the instructions.
The Power Control Unit (in the "uncore") monitors the use of 256-bit instructions approximately once every millisecond. If the Power Control Unit sees that a core is using 256-bit registers, it will stall the processor and power on the "upper" pipeline. People have seen different results on different systems, but on my Xeon E5-2660 v3 and Xeon E5-2690 v3 processors, the core is stalled for about 25,000 TSC cycles (almost 10 microseconds) before it is started up again with the full 256-bit pipeline operational. Some cores don't show any stall, but still show the quarter-speed behavior when initially using 256-bit registers.
The "upper" 128-bit pipeline remains enabled until the Power Control Unit observes that the core has not executed any instructions using 256-bit registers in the previous millisecond. I have not looked to see if there is another stall associated with powering off the "upper" 128-bit pipeline.
I am not aware of any configuration controls that allow this behavior to be overridden. The only way to make sure that there is no "start-up" penalty is to ensure that each core executes at least one instruction using 256-bit registers every millisecond.
The global average overhead is small -- 10 microsecond stall time every millisecond is only 1% overhead, and it would take some effort to create a code that actually transitioned the power of the "upper" 128-bit lanes at the maximum rate of 1000 per second.
These are my interpretations of my measurements -- I don't think that Intel has made any public statements on the topic....
- Mark as New
- Bookmark
- Subscribe
- Mute
- Subscribe to RSS Feed
- Permalink
- Report Inappropriate Content
@John McCalpin: Did you have a chance to reproduce this behavior on a newer architecture, like Skylake for example?
- Mark as New
- Bookmark
- Subscribe
- Mute
- Subscribe to RSS Feed
- Permalink
- Report Inappropriate Content
source which generates the AVX2 optimized code:
// numIterations = 1024 in the benchmark
// compiled with intel C++ compiler 16 update 3
// relevant compiler switches /O2 /Ob2 /QaxCORE-AVX2
void copy1To1 (int32 numIterations, const double* src, double* dst, float value) const
{
#pragma vector aligned
#pragma loop_count min(8), max(4096), avg(64)
	for (int32 i = 0; i < numIterations; i++)
	{
		dst = src * value;
	}
}
I've measured the deviation on another haswell (Core i7 4850HQ @ 2.3GHz) it ranges from 126ns to 620ns (AVX2) and 267ns to 307ns on SSE optimized code
On a Skylake (Xeon E3-1505M v5 @ 2.80GHz) it looks as the follows: 100ns to 170ns (AVX2) 225ns to 241 (SSE)
note: when running the benchmarks more often I will get more deviation but it clearly shows that the execution times seems to be hardly predictabe on haswell cpus.
@John McCalpin: I'm currently evaluating my benchmark which is based on google benchmark. But depending on the execution time the benchmark runs with >1 million repetitions which should possibly enough to 'warm up' the execution units. However google benchmarks has the drawback that it will only show the mean time of all executions. If there is a stall time of 10000ns in one execution the measurement is garbage. I will write my own benchmark to check for the stall time.
- Mark as New
- Bookmark
- Subscribe
- Mute
- Subscribe to RSS Feed
- Permalink
- Report Inappropriate Content
We've just found a way to speed up the AVX2 code execution on a hawell architekture by using 32byte aligned data instead of 16byte aligned data.
results on Intel(R) Xeon(R) CPU E5-2650 v3 @ 2.30 GHz
SSE: 297ns - 369ns
AVX2: 138ns - 272ns
- Mark as New
- Bookmark
- Subscribe
- Mute
- Subscribe to RSS Feed
- Permalink
- Report Inappropriate Content
>> using 32byte aligned data instead of 16byte aligned data.
That is why I wanted you to show the code, the complete code, including placement and timing.
AVX2 is 32-bytes wide.
With regards to John McCalpin's excellent comment, See what happens when you run
a) a loop of calls to your function that lasts for ~2ms duration (to assure the core transitions to wide mode), then
b) run your timed loops.
This information might be of interest to the readers.
Jim Dempsey
- Mark as New
- Bookmark
- Subscribe
- Mute
- Subscribe to RSS Feed
- Permalink
- Report Inappropriate Content
I ran across this behavior by accident when I was timing each repetition of very short data transfers (so that everything would be L1-contained).
Normally I expect the first iteration of any benchmark to be slow, so I just ignore it. In this case the iterations were short enough (under 1000 cycles) that I saw several slow iterations (about 1/4 speed), then one really slow iteration (including between 25000 and 30000 halted cycles), then full speed for the remainder of the iterations.
If I had added an internal repeat loop (inside the timers) I would not have seen this behavior and would have just ignored the first slow measurement.... Now when I am doing fine-grain measurements I precede the measured section with a call to a ~2-millisecond helper routine that definitely uses 256-bit instructions. This is not as easy as it sounds -- changing compiler options can cause the code to be compiled without 256-bit instructions without warning -- so I have to either use 256-bit intrinsics or (more commonly) I save the assembler version of the code and put the .s file on the compile line instead of the .c file.
This has been a frustration when working with complex arithmetic. The Intel C compilers (15 and 16) will often compile complex float arithmetic into 128-bit vector instructions, so if such a routine runs for >1 millisecond, the "upper" pipelines will be turned off when the next code section starts. I will be re-testing these cases with the Intel 17 compiler "Real Soon Now" (TM) to see if this problem is still common....
I don't have access to any Skylake systems, but the current Skylakes are client systems and the behavior could easily be different. We (finally) have some Broadwell (Xeon E5 v4) systems in house, so I need to test those as well....
To rule out other possible mechanisms, the tests need to be run with the frequency pinned to a fixed value and with the process pinned to a single logical processor.
Looking at the code segment in https://software.intel.com/en-us/forums/intel-isa-extensions/topic/703317#comment-1891031 it looks like the STREAM Scale kernel with double-precision variables and 1024-element (8KiB) vectors. Two vectors should be L1-contained, and AVX2 code should sustain one 32-Byte read plus one 32-Byte write per cycle. 8192 Bytes / 32 Bytes/cycle is 256 core cycles, which should be 91 ns at the nominal 2.8 GHz of the Xeon E3-1505m or 69 ns at the maximum Turbo frequency (single-core) of 3.7 GHz. These are short enough that RDTSC overhead is non-negligible if they are timed individually.
For the Xeon E5-2650 v3, 256 core cycles should be 111 ns at the nominal 2.3 GHz, or 91 ns at the maximum single-core AVX/256 Turbo frequency of 2.8 GHz.
If I recall correctly, I don't have any trouble getting close to the theoretical timing limits (after adjusting for timer overhead and mispredicted branch overhead) on Haswell cores for L1-contained data when I am only doing reads, but including stores typically results in a modest performance loss that is not easily explainable by the published descriptions of the core's performance-related parameters....
- Mark as New
- Bookmark
- Subscribe
- Mute
- Subscribe to RSS Feed
- Permalink
- Report Inappropriate Content
More notes:
- You usually need 32-byte-aligned data to get full performance on Haswell processors.
- For Loads:
- The L1 Data Cache can service two loads/cycle (any size) if neither load crosses a cache-line boundary, but can only service one load/cycle if that load crosses a cache-line boundary.
- For 32-Byte loads, this means that you need 32-Byte alignment to prevent every other load from crossing a cache-line boundary.
- For the unaligned 32-Byte load case, you can improve performance by manually re-ordering the loads from two cache lines so that the two loads from the lower half of each line are adjacent (and can execute in one cycle) while the loads from the upper half of each cache line take one cycle each.
- I have never seen the compiler do this transformation.
- The fact that the manual re-ordering improves the performance from 4 cycles (for 2 lines) to 3 cycles (for 2 lines) proves that the hardware out-of-order mechanism does not handle this automagically.
- The 1/2-speed obtained with unaligned loads is not a large penalty in the real world, so the compiler does not work terribly hard to ensure that loads are 32-byte-aligned (on Haswell and newer processors). It will do it if it is easy, but if it involves creating multiple code paths for the same loop lengths it looks like it opts for the unaligned loads with a single code path instead.
- The L1 Data Cache can service two loads/cycle (any size) if neither load crosses a cache-line boundary, but can only service one load/cycle if that load crosses a cache-line boundary.
- For Stores
- The penalty for unaligned stores is much worse than the penalty for loads, so the compiler will work very hard to avoid them.
- In this case (one store in the loop) that is quite easy, but the compiler can deal with this in several ways.
- The "#pragma vector aligned" may not mean what you think it means.
- According to the Intel 17 C++ compiler manual, this pragma "instructs the compiler to use aligned data movement instructions for all array references when vectorizing".
- This means that the compiler will not generate multiple versions of the loop to avoid stores that cross cache-line boundaries.
- So if you pass a destination pointer that is not 32-Byte-aligned, you will be crossing cache-line-boundaries on every other store, and performance will drop. (I don't know the size of the penalty for stores, but you need to look at both the penalty for stores that cross a cache line boundary and stores that cross a 4KiB page boundary -- the latter may be large enough to be important even though it happens only once per 64 lines.)
- The penalty for unaligned stores is much worse than the penalty for loads, so the compiler will work very hard to avoid them.
Any low-level benchmark of this type really needs performance counter support for validation. Lots of the counter events are broken, but there are still plenty of useful ones that could be used here. On Haswell I would start with these 8 (that can all be measured at once if HyperThreading is disabled, otherwise it will take two runs):
- MISALIGN_MEM_REF.LOADS
- MISALIGN_MEM_REF.STORES
- LD_BLOCKS_PARTIAL.ADDRESS_ALIAS ---> slowdown if dst has too many bits in common with src
- CPU_CLK_UNHALTED.THREAD_P
- L1D.REPLACEMENT ---> just to be sure data is really coming from L1
- INST_RETIRED.ANY_P
- MEM_UOPS_RETIRED.ALL_LOADS
- MEM_LOAD_UOPS_RETIRED.L1_HIT
These should be run with the process pinned to a single logical processor and the frequency pinned to a fixed value.
The overhead of reading 8 counters using the RDPMC instruction is likely to be 200-300 cycles, so I would experiment with different measurement granularity -- reading the counters for every call to the "copy1to1" routine, every 2 calls, every 4 calls, ... every 128 calls.
Notes:
- It is CRITICAL to ensure that the data pages that you will use to hold the counter values are instantiated before use --- a page fault when you go to write a counter value to memory will really mess up any subsequent counter reads.
- It is very helpful to pay attention to the "footprint" of the counter values that you are saving so that these don't overflow the L1 Data Cache. The code under test is using 1/2 of the L1 Data Cache, so I would recommend performing a small enough number of measurements that you don't expect to use more than 1/4 of the L1 Data Cache to hold the counter values. You should write zeros to these memory locations immediately before you begin executing a sequence of tests, so that when you store the counter values, you get L1 Data Cache hits.
- Mark as New
- Bookmark
- Subscribe
- Mute
- Subscribe to RSS Feed
- Permalink
- Report Inappropriate Content
Thanks a lot for this very detailled information!
What I did so far is writing a benchmark with a timer which is based on reading the TSC register
RDTSCTimer::RDTSCTimer ()
{
	LARGE_INTEGER frequency;
	QueryPerformanceFrequency (&frequency);
	nsScaler = (double)1000000 / (frequency.QuadPart);
}

void RDTSCTimer::start ()
{
	startTimestamp = __rdtsc ();
}

void RDTSCTimer::stop ()
{
	endTimestamp = __rdtsc ();
}

uint64 RDTSCTimer::getElapsedNanoseconds () const
{
	const uint64 elapsedCycles = (endTimestamp - startTimestamp);
	return (double)elapsedCycles * nsScaler;
}
The process runs with priority 15 and the affinity mask is set to a single core. The actual test code runs in a loop with 15m repetitions to generate a histogram of the execution times
	while (counter < numRepetitions)
	{
		timer->start ();
		implementation.copy1To1 (bufferSize, outStreams[0], inStreams[0], 0.333F);
		timer->stop ();
		int64 elapsed = timer->getElapsedNanoseconds ();
		addElapsedTime (elapsed, result);
		overallElapsedNs += elapsed;
		counter++;
	}
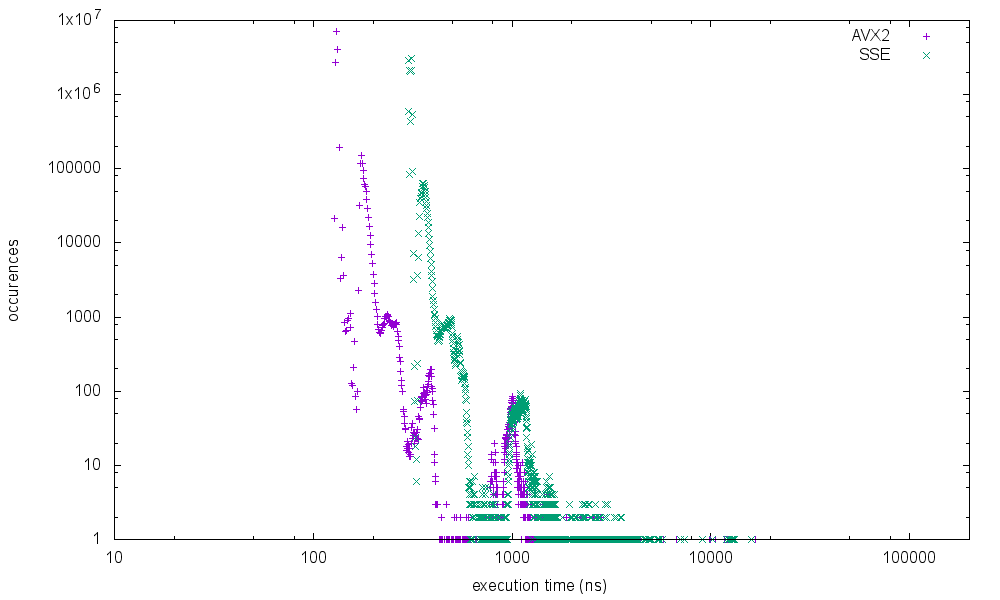
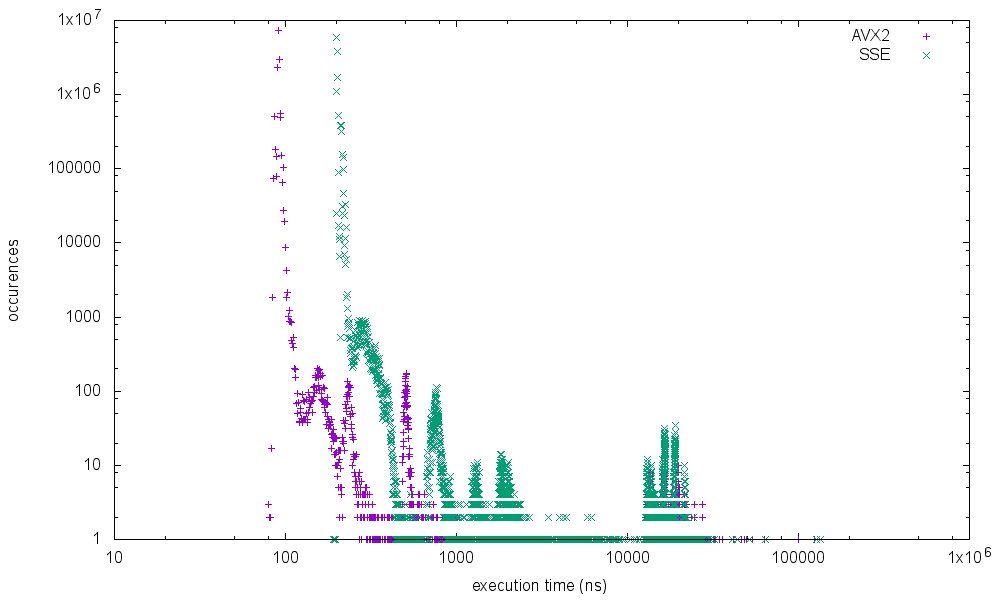
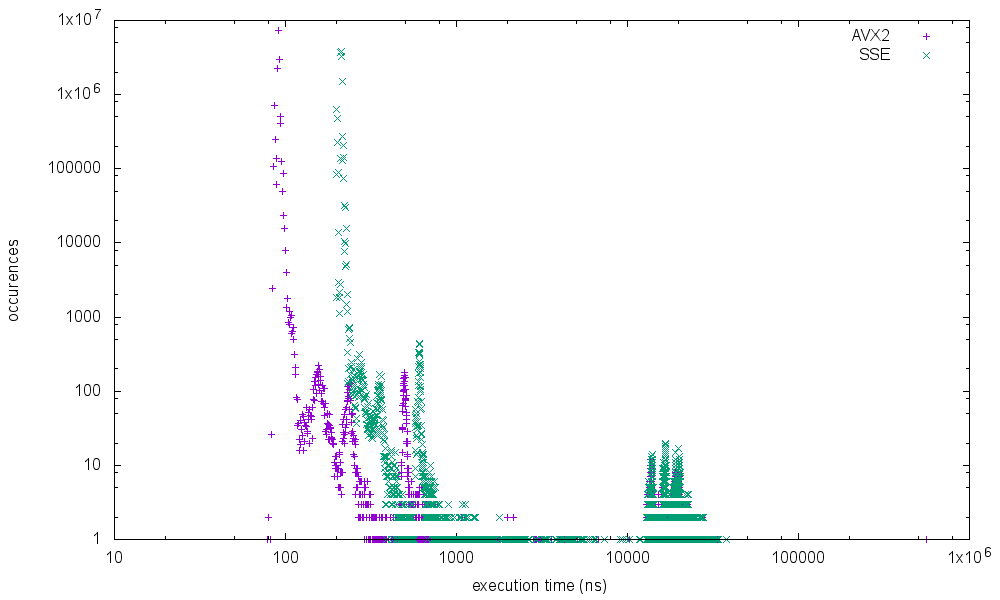
running it on different processors shows the following results
Core i7 4850HQ @ 2.30GHz (haswell)
Xeon E3 1505M v5 @ 2.80GHz (skylake)
Xeon E5 2650 v3 @ 2.30GHz (haswell)
Intrestingly the skylake mobile processor shows the worst results for the max execution time. I've not started further investigation why the spikes are occuring at specific execution times and if it is possible to get rid of it completely but I will add some more metrics in the future.
- Mark as New
- Bookmark
- Subscribe
- Mute
- Subscribe to RSS Feed
- Permalink
- Report Inappropriate Content
Some of these slow iterations have elapsed time that corresponds to reasonable values for processing OS scheduler interrupts -- values in the 10 microsecond range. The details depend on the processor frequency, the number of cores, the OS, and potentially other factors.
The values in the 1 microsecond range are a bit less obvious to me, but there are always lots of other things going on in the background, and this may be due to an external event like a TLB shootdown. A reference to an older Intel processor (Xeon E5640, Westmere EP) with TLB shootdown overhead in the 1 microsecond range is https://pdfs.semanticscholar.org/6060/f21eb426c2b9b12d91fdfd00f4b775024b15.pdf
- Mark as New
- Bookmark
- Subscribe
- Mute
- Subscribe to RSS Feed
- Permalink
- Report Inappropriate Content
I did some further measurements on the same system with results up to 0.5ms execution time.
But as you have already mentioned I would not take these results too serious. We did run the benchmarks on a Lenovo P50 with factory defaults which runs a lot of suspicious services. (We've already seen in a trace that some of these services are issuing slow DPC calls sometimes)
In addtion the benchmark itself might have a flaw. I suspect that storing the result of one run in a hashmap before the next iteration is likely to influence the L1 data access of the next run. Not least I'm happy that the issue of my initial question is solved. All the benchmarks are now clearly showing that the autovectorized AVX2 code runs faster (most of the time) than the manually optimized SSE variant.
- Subscribe to RSS Feed
- Mark Topic as New
- Mark Topic as Read
- Float this Topic for Current User
- Bookmark
- Subscribe
- Printer Friendly Page