- Mark as New
- Bookmark
- Subscribe
- Mute
- Subscribe to RSS Feed
- Permalink
- Report Inappropriate Content
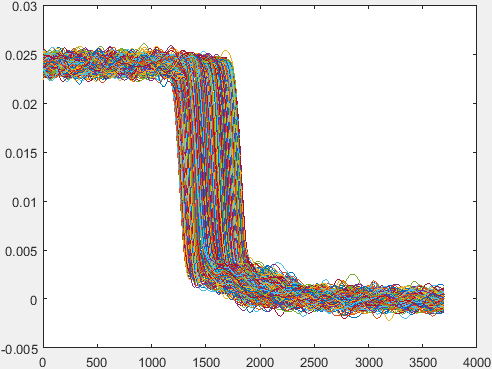
Hi, I am trying to calculate the MTF (modulation transfer function) of a radiograph. Multiple lines are drawn over a region that goes from high attenuation values to low attenuation values. These lines are sampled at the rate of 0.01mm. The following graph shows the attenuation value distribution of each of these lines:
Each of these lines are the differentiated and the last value is repeated in order to maintain the length. The following graph shows the differentiated graph of each of these lines:
X axis in both these graphs is the number of samples. The lowest value at each point on the x axis is taken so that there is no offset and so we get the following graph:
The FFT of this is taken and half of the values are used as the other half are complex conjugate. Before passing to the FFT function the array with the differentiated values is padded with the last value in the array so that the size of the array is a power of 2. From the FFT we get the following result.
Here the result is as expected. Now the same procedure is repeated with just one difference. The sampling rate is now 0.02 mm instead of 0.01 mm as before. The MTF from this look like:
Here the result is as expected. Now the same procedure is repeated with just one difference. The sampling rate is now 0.02 mm instead of 0.01 mm as before. The MTF from this look like:
Similar results are seen with sampling rates of 0.03,0.04. Sampling rate of 0.05 works fine. X axis in case of MTF is represented in line pairs/mm. The FFT is carried out using the Intel library IPP. When using Matlab all MTF graphs show same form as here shown in the graph with sampling rate 0.01 mm.
I wanted to ask if this is due to the misalignment with DFT bins or is there something happening in the FFT function. If this is the case then why does it work fine with Matlab? I also tried increasing the sampling rate to 0.001 mm and 0.002 mm and the results seem fine in that case but I am ruling out aliasing because the results with 0.05 mm are fine as mentioned before.
Link Copied
- Mark as New
- Bookmark
- Subscribe
- Mute
- Subscribe to RSS Feed
- Permalink
- Report Inappropriate Content
Hi Mueez,
could you be more specific - could you provide all fields from ippsGetLibVersion:
const IppLibraryVersion* lib;
lib = ippsGetLibVersion();
printf("major = %d\n",lib->major);
printf("minor = %d\n",lib->minor);
printf("majorBuild = %d\n",lib->majorBuild);
printf("build = %d\n",lib->build);
printf("targetCpu = %c%c%c%c\n",lib->targetCpu[0],lib->targetCpu[1],lib->targetCpu[2],lib->targetCpu[3]);
printf("Name = %s\n", lib->Name);
printf("Version = %s\n", lib->Version);
printf("BuildDate = %s\n", lib->BuildDate);
also could you provide any reproducer code (both for Matlab and IPP) (or numeric data used for input + expected results and results from IPP function + parameters you use for IPP function + full function name).
Regards, Igor
- Mark as New
- Bookmark
- Subscribe
- Mute
- Subscribe to RSS Feed
- Permalink
- Report Inappropriate Content
Hello Igor,
Thank you for the reply. Upon further inspection I found a mistake in my own calculation and fixed it. Results are fine now. Thank you for the assistance.
- Subscribe to RSS Feed
- Mark Topic as New
- Mark Topic as Read
- Float this Topic for Current User
- Bookmark
- Subscribe
- Printer Friendly Page


