- Mark as New
- Bookmark
- Subscribe
- Mute
- Subscribe to RSS Feed
- Permalink
- Report Inappropriate Content
Hello,
I have a memory leak when running code that uses a Gradient Boosted Trees model and I cannot figured out where does it come.
Here is a sample that reproduces my problem:
int GradientBoostedTreesConstantTestToSend() {
  int nRows = 1000;
  int nCols = 10;
  double* features = new double[nRows * nCols];
  double* labels = new double[nRows];
  for (int i = 0; i < nRows; ++i) {
    for (int j = 0; j < nCols; ++j){
      features[i * nCols + j] = i + 1.0;
      labels = 66.0;
    }
  }
  const int nbTrees = 50;
  const int maxTreeDepth = 6;
  const double regularizationParameter = 0.3;
  const int minObservationsInLeafNode = 5;

  for (int k = 0; k < 10000; k++) {
    const NumericTablePtr featureSamplesTable(new HomogenNumericTable<double>(features, nCols, nRows));
    const NumericTablePtr targetValuesTable(new HomogenNumericTable<double>(labels, 1, nRows));
    training::Batch<> algorithm;
    // Pass a training data set to the algorithm
    algorithm.input.set(training::data, featureSamplesTable);
    algorithm.input.set(training::dependentVariable, targetValuesTable);
    // Gradient Boosted Trees model config
    algorithm.parameter().maxIterations = nbTrees;
    algorithm.parameter().maxTreeDepth = maxTreeDepth;
    algorithm.parameter().shrinkage = regularizationParameter;
    algorithm.parameter().minSplitLoss = 0;
    algorithm.parameter().lambda = 1;
    algorithm.parameter().observationsPerTreeFraction = 1;
    algorithm.parameter().featuresPerNode = 0;
    algorithm.parameter().minObservationsInLeafNode = minObservationsInLeafNode;
    // Train Gradient Boosted Trees model
    if(!algorithm.compute().ok())
    {
      printf("\nOups, something went wrong ...\n");
      delete[] features;
      delete[] labels;
      return 1;
    }
  }
  delete[] features;
  delete[] labels;
  return 0;
}
If you run the above code you will see the amount of memory used is growing and never go down. It happens with 32 and 64bit mode.
Did I forgot to call a method to clean DAAL objects ?
Thanks in advance for your help,
Guillaume A.
My config:
- Visual Studio 2019
- Intel Composer 2019.5.281
- BasePlatformToolSet: V141
- Windows 10 (x64)
- Tags:
- Bug
- Mark as New
- Bookmark
- Subscribe
- Mute
- Subscribe to RSS Feed
- Permalink
- Report Inappropriate Content
Link Copied
- Mark as New
- Bookmark
- Subscribe
- Mute
- Subscribe to RSS Feed
- Permalink
- Report Inappropriate Content
Hi Guillaume,
Thanks for reaching out to us !!
Could you please share complete code including data for debugging the same ?
- Mark as New
- Bookmark
- Subscribe
- Mute
- Subscribe to RSS Feed
- Permalink
- Report Inappropriate Content
Hi Adweidh, thanks for your reply.
What do you mean by data ? In my thought the arrays features and labels are data.
I am sorry but I am not allowed to share all code because of my firm privacy policy. I ensure you that the code in my first post reproduces the problem.
Regards,
Guillaume A.
- Mark as New
- Bookmark
- Subscribe
- Mute
- Subscribe to RSS Feed
- Permalink
- Report Inappropriate Content
Hi Guillaume,
Yes, I managed to build your example on win64 with daal2020.1 and will check the leaks you observed.
Gennady
- Mark as New
- Bookmark
- Subscribe
- Mute
- Subscribe to RSS Feed
- Permalink
- Report Inappropriate Content
Checking the problem by Intel Inspector, I see no memory leaks detected:
/opt/intel/inspector_2020.1.0.604266/bin64/inspxe-cl -collect mi1 ./a.out
Collection started. To stop the collection, either press CTRL-C or enter from another console window: inspxe-cl -r ...gfedorov/_work/daal_forum/u851456/r000mi1 -command stop.
0 new problem(s) found
- Mark as New
- Bookmark
- Subscribe
- Mute
- Subscribe to RSS Feed
- Permalink
- Report Inappropriate Content
Hello Gennady, thanks for your reply.
Um ok... maybe something have been fixed with the version 2020.1.
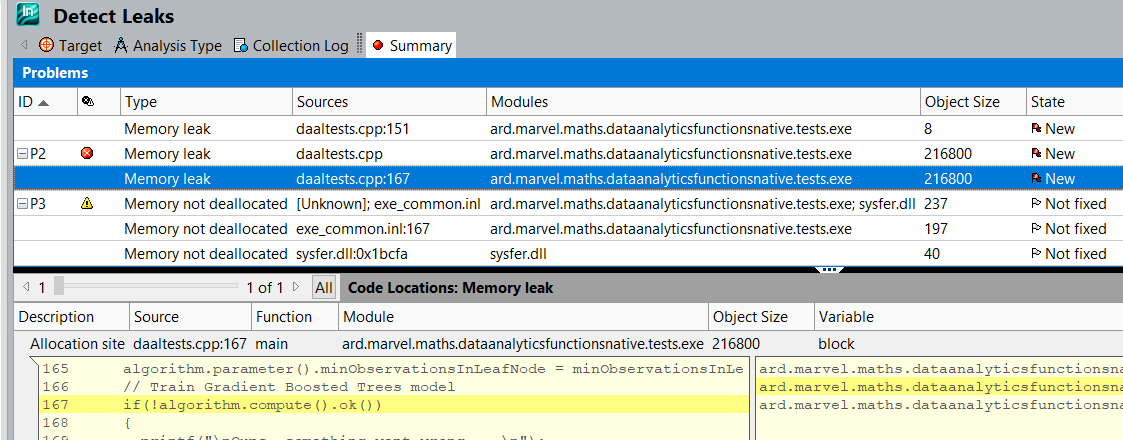
I just tried with Parallel Studio 2020.0.075 (with Composer 2020.0.166 so) and it does find leaks.
In attachment:
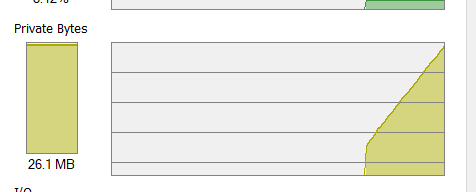
- A screenshot of the Inspector analyse result (impossible to attache the whole analyse result export file ...) NB: I reduce the number of my sample iterations to 100.
- A screenshot of the memory consumption with 10000 iterations. Observed with Process Explorer.
I will try to get the latest version of Parallel Studio but it is complicated currently... (work at home, low bandwidth, difficulty to join IT team ... )
Regards,
Guillaume A.
- Mark as New
- Bookmark
- Subscribe
- Mute
- Subscribe to RSS Feed
- Permalink
- Report Inappropriate Content
Hello,
I recompiled the test with Composer 2020.1.216 and ran it with Inspector 2020 update 1. It still finds a leak here:
if(!algorithm.compute().ok())
In attachment:
- A screenshot of the Inspector 2020 update 1 analyse result. NB: I reduce the number of my sample iterations to 100.
- My compilation options
Thanks for your help,
Guillaume A.
- Mark as New
- Bookmark
- Subscribe
- Mute
- Subscribe to RSS Feed
- Permalink
- Report Inappropriate Content
Hi Guillaume A.
Thank you a lot for reproducing the case. I will investigate it and get back to you later.
Thanks
Ying
- Mark as New
- Bookmark
- Subscribe
- Mute
- Subscribe to RSS Feed
- Permalink
- Report Inappropriate Content
- Mark as New
- Bookmark
- Subscribe
- Mute
- Subscribe to RSS Feed
- Permalink
- Report Inappropriate Content
Okay. Thanks.
Guillaume A.
- Mark as New
- Bookmark
- Subscribe
- Mute
- Subscribe to RSS Feed
- Permalink
- Report Inappropriate Content
Hi Guillaume,
I'm glad to get the news about the issue is supposed fixed in DAAL latest release 2020 update 2. could you please try the version and let us know if any problem.
Thanks
Ying
- Subscribe to RSS Feed
- Mark Topic as New
- Mark Topic as Read
- Float this Topic for Current User
- Bookmark
- Subscribe
- Printer Friendly Page