- Mark as New
- Bookmark
- Subscribe
- Mute
- Subscribe to RSS Feed
- Permalink
- Report Inappropriate Content
I am using a code (Wien2k) which extensively exploits lapavck/scalapack via the mkl library, and can also work in hybrid mode with openmp+mpi. In my prior experience, and that of others, the hybrid mode with 2 openmp threads was slightly slower, perhaps 10%.
With a 64 core Gold 6338 it is very different, with 2 openmp & the rest mpi ~1.6 times faster! I cannot explain this, and I am wondering whether this somehow relates to the architecture or is a bug with using all 64 mpi.
For reference I am using 2021.1.1 versions of mkl/compiler/impi as later ones don't work for reasons I have not been able to determine (large program for matrix eigensolving hangs).
I can provide a way to reproduce this, but it would involve transferring a large code & some control files.
- Mark as New
- Bookmark
- Subscribe
- Mute
- Subscribe to RSS Feed
- Permalink
- Report Inappropriate Content
Slightly embarrassing!
Before posting in November I double checked the timings, talked to a colleague in Cambridge who had seen something similar on other code and also checked with the local sys_admins for the cluster at Northwestern. Everyone indicated it was real, with other info on the internet that was similar.
When you asked for timings with 2 nodes (attached), the full mpi was not 1.5 times slower. I rechecked and with 3 nodes it is now also not abnormally slower. Investigating, not soon after my tests & posting I was told that a switch on the cluster relevant to the nodes I was using died, and also one of the nodes I was using died. I do not know specifics, and I suspect both have now been recycled. My guess is that there were major hardware problems at the time of the test which were being patched by some slow fault-tolerant algorithms, but costing a lot of time. A guess only, and I have no idea why this should effect pure mpi more than hybrid.
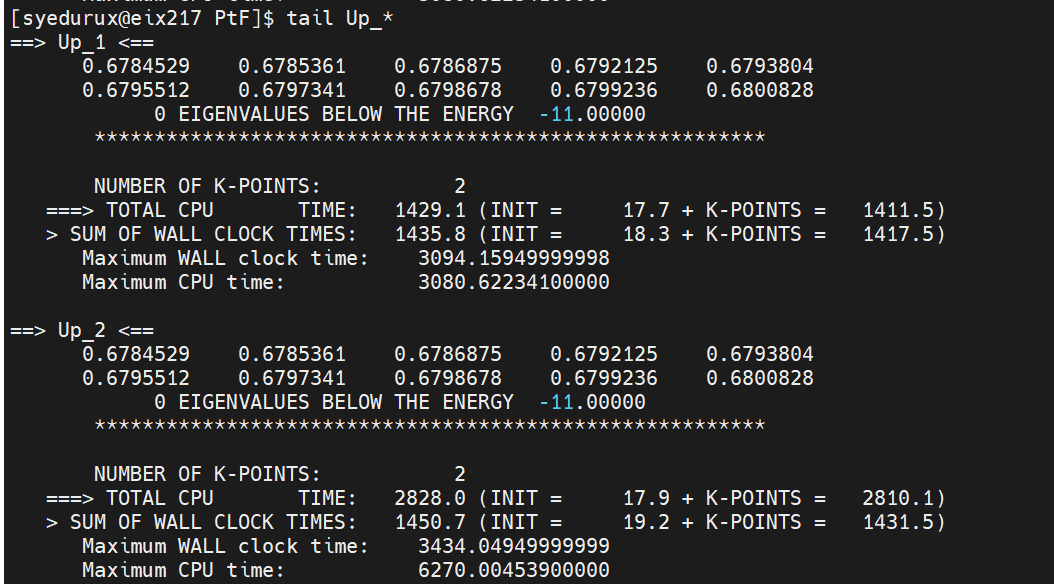
Attached in a tar is the output with 2 nodes of grep -ie time Up_1 and Up_2. I edited slightly PtF.klist (also attached) so the calculations would be faster. I am also attaching the M1 and M2 to use for these. It will still be interesting to know what your timings are.
Link Copied
- « Previous
-
- 1
- 2
- Next »
- Mark as New
- Bookmark
- Subscribe
- Mute
- Subscribe to RSS Feed
- Permalink
- Report Inappropriate Content
Do you have a (very) slow NFS mounted disk that the files are being stored to, i.e. the directory PtF? If I assume that it is taking an extraordinary time (900sec!) to do I/O I can understand your numbers -- if I remove about 900 seconds then the WALL and CPU time approximately match well; they should be CPU ~ WALL*(Number of Threads). If this is the case, then your Omni-Path is doing a better job than the supercomputer I am using, and I will have to push the sys admins locally to investigate. (They may have tuned something incorrectly.)
If you have a fast NSF then I am very confused. For reference, I am attaching my results.
- Mark as New
- Bookmark
- Subscribe
- Mute
- Subscribe to RSS Feed
- Permalink
- Report Inappropriate Content
Also, can we check that we are truly comparing systems -- you might be using better (faster) memory. The system I am using has
- Processor: Intel(R) Xeon(R) Gold 6338 CPU @ 2.0GHz
- Memory: Per node (Per Core) 256 GB (4 GB), Type: DDR4 2666 MHz
- Interconnect: Infiniband HDR compatible
- Red Hat Enterprise Linux 7.9
I am not a hardware specialist, so I would have to get expert advice (from people at Northwestern) for more details.
- Mark as New
- Bookmark
- Subscribe
- Mute
- Subscribe to RSS Feed
- Permalink
- Report Inappropriate Content
Hi Laurence,
Ok, I think then the processor differs in our case and hence the difference in results.
Here is the output of lscpu
Architecture:    x86_64
CPU op-mode(s):   32-bit, 64-bit
Byte Order:     Little Endian
CPU(s):       144
On-line CPU(s) list: 0-143
Thread(s) per core: 2
Core(s) per socket: 36
Socket(s):      2
NUMA node(s):    2
Vendor ID:      GenuineIntel
CPU family:     6
Model:        106
Model name:     Intel(R) Xeon(R) Platinum 8360Y CPU @ 2.40GHz
Stepping:      6
CPU MHz:       2400.000
CPU max MHz:     2401.0000
CPU min MHz:     800.0000
BogoMIPS:      4800.00
L1d cache:      48K
L1i cache:      32K
L2 cache:      1280K
L3 cache:      55296K
NUMA node0 CPU(s):  0-35,72-107
NUMA node1 CPU(s):  36-71,108-143
Flags:        fpu vme de pse tsc msr pae mce cx8 apic sep mtrr pge mca cmov pat pse36 clflush dts acpi mmx fxsr sse sse2 ss ht tm pbe syscall nx pdpe1gb rdtscp lm constant_tsc art arch_perfmon pebs bts rep_good nopl xtopology nonstop_tsc cpuid aperfmperf pni pclmulqdq dtes64 monitor ds_cpl smx est tm2 ssse3 sdbg fma cx16 xtpr pdcm pcid dca sse4_1 sse4_2 x2apic movbe popcnt tsc_deadline_timer aes xsave avx f16c rdrand lahf_lm abm 3dnowprefetch cpuid_fault epb cat_l3 invpcid_single ssbd mba ibrs ibpb stibp ibrs_enhanced fsgsbase tsc_adjust bmi1 avx2 smep bmi2 erms invpcid cqm rdt_a avx512f avx512dq rdseed adx avx512ifma clflushopt clwb intel_pt avx512cd sha_ni avx512bw avx512vl xsaveopt xsavec xgetbv1 xsaves cqm_llc cqm_occup_llc cqm_mbm_total cqm_mbm_local split_lock_detect wbnoinvd dtherm ida arat pln pts hwp hwp_act_window hwp_epp hwp_pkg_req avx512vbmi umip pku ospke avx512_vbmi2 gfni vaes vpclmulqdq avx512_vnni avx512_bitalg tme avx512_vpopcntdq la57 rdpid fsrm md_clear pconfig flush_l1d arch_capabilities
Please let me know if you think the issue is specific to only the Intel Xeon gold CPU.
>>Do you have a (very) slow NFS mounted disk ...
Also could you please let me know if there are any metrics/parameters to know if it is slow?
Regards,
Vidya.
- Mark as New
- Bookmark
- Subscribe
- Mute
- Subscribe to RSS Feed
- Permalink
- Report Inappropriate Content
Comparing your Platinum CPU with my Gold is somewhat like comparing a speedboat and a car, or comparing a Ford and a Chevrolet. There might be some use, but it is not direct. I had trouble finding benchmarks for your cpu so I am not sure.
It is important to know your memory speed and how much you have. You can do a Google search on "get ram speed Linux" although you may need sudo rights.
For nfs I suggest putting "test nfs speed" into Google search, then looking. This is outside my expertise, and maybe your sys_admin can help. I suspect that you have the files I sent on a disk which has a slow connection (e.g. Ethernet) to the cluster. You want them to be on a disk that is local to the first node in M1, or is also on your omnipath. Sometimes you can use /tmp.
I can tell your nfs is slow from the line "CPUTIME ATPAR". This includes some I/O. These can be compared to the line "Time for alm" which is similar for your and my cluster (Wall, the second number). I have 13.8 for ATPAR, you have 21.7 which is a strong indicator of slow I/O.
There are some other features to the numbers that also indicate this. The software you are using, part of Wien2k, is very good at finding OS problems.
- Mark as New
- Bookmark
- Subscribe
- Mute
- Subscribe to RSS Feed
- Permalink
- Report Inappropriate Content
Hi Laurence,
Thanks for the information.
We are working on your issue, we will get back to you soon.
Regards,
Vidya.
- Mark as New
- Bookmark
- Subscribe
- Mute
- Subscribe to RSS Feed
- Permalink
- Report Inappropriate Content
Hi Mark,
Apologies for the delay.
Could you please provide us with the timings that you are getting when running the application using 2 nodes (currently we are having access to the cluster which has Xeon Gold CPU on 2 nodes) so that I can report it to the concerned development team after checking the same?
Regards,
Vidya.
- Mark as New
- Bookmark
- Subscribe
- Mute
- Subscribe to RSS Feed
- Permalink
- Report Inappropriate Content
Slightly embarrassing!
Before posting in November I double checked the timings, talked to a colleague in Cambridge who had seen something similar on other code and also checked with the local sys_admins for the cluster at Northwestern. Everyone indicated it was real, with other info on the internet that was similar.
When you asked for timings with 2 nodes (attached), the full mpi was not 1.5 times slower. I rechecked and with 3 nodes it is now also not abnormally slower. Investigating, not soon after my tests & posting I was told that a switch on the cluster relevant to the nodes I was using died, and also one of the nodes I was using died. I do not know specifics, and I suspect both have now been recycled. My guess is that there were major hardware problems at the time of the test which were being patched by some slow fault-tolerant algorithms, but costing a lot of time. A guess only, and I have no idea why this should effect pure mpi more than hybrid.
Attached in a tar is the output with 2 nodes of grep -ie time Up_1 and Up_2. I edited slightly PtF.klist (also attached) so the calculations would be faster. I am also attaching the M1 and M2 to use for these. It will still be interesting to know what your timings are.
- Mark as New
- Bookmark
- Subscribe
- Mute
- Subscribe to RSS Feed
- Permalink
- Report Inappropriate Content
- Mark as New
- Bookmark
- Subscribe
- Mute
- Subscribe to RSS Feed
- Permalink
- Report Inappropriate Content
Your hybrid case is a little slower than mine, but I don't think that matters.
The good news is that the information that more mpi (i.e. 64 cores) has issues seems to be incorrect, at least in this case.
Thanks for your efforts.
- Mark as New
- Bookmark
- Subscribe
- Mute
- Subscribe to RSS Feed
- Permalink
- Report Inappropriate Content
Hi Mark,
Thanks for the confirmation.
As the issue is resolved we are closing this thread. Please post a new question if you need any additional assistance from Intel as this thread will no longer be monitored.
Have a Nice Day!
Regards,
Vidya.
- Subscribe to RSS Feed
- Mark Topic as New
- Mark Topic as Read
- Float this Topic for Current User
- Bookmark
- Subscribe
- Printer Friendly Page
- « Previous
-
- 1
- 2
- Next »