- Mark as New
- Bookmark
- Subscribe
- Mute
- Subscribe to RSS Feed
- Permalink
- Report Inappropriate Content
XTU version 6.1.2.8 on i7-4790k:
In this version my active core count peaks at 2, using the previous XTU version it peaked at 4 for the same programs.
Any idea why this changed, and is it correct? My performance criteria is based on active core count.
Link Copied
- « Previous
-
- 1
- 2
- Next »
- Mark as New
- Bookmark
- Subscribe
- Mute
- Subscribe to RSS Feed
- Permalink
- Report Inappropriate Content
I am still investigating about this matter, as soon as I have more details I will update the thread.
Regards,
Amy.
- Mark as New
- Bookmark
- Subscribe
- Mute
- Subscribe to RSS Feed
- Permalink
- Report Inappropriate Content
I am also having this problem. I've been really freaking out trying to understand and or fix this and I am very relieved to see that it might be a software error. I am running a I7-6700k... 4 core, 8 logical. The ETU says Active core count (1)... All of the time.. If I stress test, it will go up to 2 and then back down. I have tried several bench and stressors and nothing can trigger 3-4. With that being said I am getting 99th percentile scores for my CPU with passmark and CPU-Z (I also scored higher than the reference). Soooooo, that's interesting because if the chip TRULY wasn't using all 4 cores at any time... Wouldn't I have a bad benchmark!? Although I'm staring at the XTU now and it's laughing at me saying active core count 1. My theory is it's just cut in half.. So in reality, two cores are active.. And when its telling me 2 are active during a stress test, maybe really all four are running. I have updated all the drivers that were mentioned in this article and my bios is flashed to the newest version. Thanks!
- Mark as New
- Bookmark
- Subscribe
- Mute
- Subscribe to RSS Feed
- Permalink
- Report Inappropriate Content
KeanuReeves, thank you for your input.
I am still checking on this.
Regards,
Amy.
- Mark as New
- Bookmark
- Subscribe
- Mute
- Subscribe to RSS Feed
- Permalink
- Report Inappropriate Content
Amy,
The initial appearance is that the problem is solved. Wile the active core count seems to stay at 0 most of the time, the active core count does go to 4 on a 4790K processor under extreme stress, which is better than the 2 that we have seen recently. Any idea why the active core count is 0 when trivial things are running?
Progress is being made. I will check out the other features in a few days,
thanks
- Mark as New
- Bookmark
- Subscribe
- Mute
- Subscribe to RSS Feed
- Permalink
- Report Inappropriate Content
Good to hear!
Are you on version https://downloadcenter.intel.com/download/24075/Intel-Extreme-Tuning-Utility-Intel-XTU-?product=66427 Download Intel® Extreme Tuning Utility (Intel® XTU)?
Regards,
Amy.
- Mark as New
- Bookmark
- Subscribe
- Mute
- Subscribe to RSS Feed
- Permalink
- Report Inappropriate Content
Yes I am on the .17 version.
- Active thread count appears to be working, except the active count goes to 0 for a long time while the system is actively doing things. I presume that there must be a core %utilization count that must be achieved before it can be counted as active by IETU. It's just different than before. Can you tell us what the definition of an active core is?
- 2 I have a new problem in that I am unable to save and use any profiles. If I save a profile (or more) and try to switch between them, nothing happens. If I end IETU and restart it, all profiles are gone, and only "Default n/a n/a n/a n/a" appears in the profiles menu. Should I open another item for this problem?
Thanks for all your help.
- Mark as New
- Bookmark
- Subscribe
- Mute
- Subscribe to RSS Feed
- Permalink
- Report Inappropriate Content
I will review your question for the active core count.
Now, I have a https://www.asus.com/Motherboards/Z170-A/ Z170-A | Motherboards | ASUS Global, http://ark.intel.com/products/88195/Intel-Core-i7-6700K-Processor-8M-Cache-up-to-4_20-GHz Intel® Core™ i7-6700K Processor (8M Cache, up to 4.20 GHz) Specifications, Windows® 10 and https://downloadcenter.intel.com/download/24075/Intel-Extreme-Tuning-Utility-Intel-XTU-?product=66427 Download Intel® Extreme Tuning Utility (Intel® XTU). Created 3 completely different profiles, rebooted and 3 profiles are there including the Default profile. I have switched between them and they behave as expected.
Regards,
Amy.
- Mark as New
- Bookmark
- Subscribe
- Mute
- Subscribe to RSS Feed
- Permalink
- Report Inappropriate Content
I can not believe that it is a CPU or Motherboard issue. It may be that something is corrupted in Widows. I have removed and reinstalled IXTU, and the problem repeats.
Can you give me instructions on how to remove all registry entries, files and folders that remain after uninstall? I would bet that there is something lingering on my system, but I will not reinstall the OS to resolve the problem.
- Mark as New
- Bookmark
- Subscribe
- Mute
- Subscribe to RSS Feed
- Permalink
- Report Inappropriate Content
I had a fresh install of Windows® 10.
Try this http://www.askvg.com/how-to-completely-uninstall-remove-a-software-program-in-windows-without-using-3rd-party-software/ How to Completely Uninstall / Remove a Software Program in Windows without using 3rd Party Software? - AskVG.
The content on the above site is not controlled by Intel. This information is offered for your convenience and should not be viewed as an endorsement by Intel for the merchants or services offered there.
Regards,
Amy.
- Mark as New
- Bookmark
- Subscribe
- Mute
- Subscribe to RSS Feed
- Permalink
- Report Inappropriate Content
I deleted xtu from the control panel, and deleted all "Extreme Tuning" registry entries, and deleted all "XTU" entries in the registry.
Profiles are now working again.
Thanks Amy
This should close this item for me.
- Mark as New
- Bookmark
- Subscribe
- Mute
- Subscribe to RSS Feed
- Permalink
- Report Inappropriate Content
Awesome, .
As soon as I have the answer for your question regarding the Active core, I will update the thread.
Regards,
Amy.
- Mark as New
- Bookmark
- Subscribe
- Mute
- Subscribe to RSS Feed
- Permalink
- Report Inappropriate Content
/thread/104277 Tas3086A,
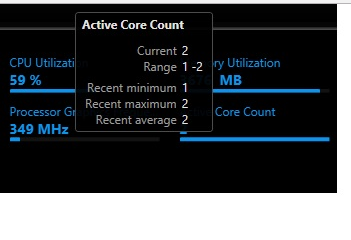
The Active Core Count is a dynamic value. See more explanation of the system monitor: Each system monitor consists of the name of the measured value, the current value, and a bar that shows the range of the measurement. The current values in system monitors update in real-time. You can view statistical data about a particular monitor by moving your mouse over it and briefly pause. After a short wait, a small window will display the current value, the range, the minimum, the maximum, and the average for the monitor under your mouse pointer.
See an example of Active Core Count in my system for you reference.
Regards,
Amy.
- Mark as New
- Bookmark
- Subscribe
- Mute
- Subscribe to RSS Feed
- Permalink
- Report Inappropriate Content
Amy, I agree completely. But please see my picture.
Note that the active core count is 0, range is 1-4, recent minimum and average are 0.
on my system, 4 cores can be running at 11,4,3 and 2% Yet active core count displays as 0.
The count does bounce up to 1,2,3 & 4 when greater CPU stress is placed on the processor.
In the old XTU the active core count value of 0 was never shown, The value was always 1 or more. Just like the range :1-4 Your range should be showing 0-4.if 0 is a valid value.
0 just does not seem a realistic value, unless you specify that a core must be at 15% before it is counted as active. I'd just like to know how busy does a core need to be before it is counted as active? I know that 11% does not tick the counter !
- Mark as New
- Bookmark
- Subscribe
- Mute
- Subscribe to RSS Feed
- Permalink
- Report Inappropriate Content
"The count does bounce up to 1,2,3 & 4 when greater CPU stress is placed on the processor."
I did notice the same behavior on my test.
Let check this one more time.
Regards,
Amy.
- Mark as New
- Bookmark
- Subscribe
- Mute
- Subscribe to RSS Feed
- Permalink
- Report Inappropriate Content
There was an issue with the earlier XTU as it was showing active core count by default to 1 which was fixed in the newer version and shows 0 by default. There is an internal threshold so if any one of the logical threads of a core is above 50% utilization ( C0 state), then the core will be considered as active in the XTU. Active core count is shown based on this threshold. In summary the latest XTU is improved and the active core showing 0 is the correct information.
Regards,
Amy.
- Mark as New
- Bookmark
- Subscribe
- Mute
- Subscribe to RSS Feed
- Permalink
- Report Inappropriate Content
Excellent information. 50% is the point at which an active core is determined.
That makes the information that I see seem validated.
Thank you very much for your in-depth research..
- Mark as New
- Bookmark
- Subscribe
- Mute
- Subscribe to RSS Feed
- Permalink
- Report Inappropriate Content
Good to hear!
If you need further assistance let us know.
Regards,
Amy.
- Subscribe to RSS Feed
- Mark Topic as New
- Mark Topic as Read
- Float this Topic for Current User
- Bookmark
- Subscribe
- Printer Friendly Page
- « Previous
-
- 1
- 2
- Next »