- Mark as New
- Bookmark
- Subscribe
- Mute
- Subscribe to RSS Feed
- Permalink
- Report Inappropriate Content
Hi,
INDE API trace was working wonderfully for a few days and suddenly stopped returning any trace information. I started investigating and noticed that, when enabled, another Intel OpenCL platform shows up at runtime when I query all available platforms. Using this newly created OpenCL platform, again that only shows up when API trace is enabled, allows me to get the trace results that I was looking for. Why it worked two days ago without any adjustments to my code is still a mystery to me.
But I'm happily tracing again, I'm just curious if this nuance is expected and documented somewhere?
For what its worth, here is my configuration:
Windows 7
Visual Studio 2012 Version 11.0 update 4
Code Builder 1.3.0.43
Link Copied
- Mark as New
- Bookmark
- Subscribe
- Mute
- Subscribe to RSS Feed
- Permalink
- Report Inappropriate Content
Logan,
I'll ask our developers about this issue. Sounds very strange! Any chance that you could move to Windows 8.1 and Visual Studio 2013 :) ?
- Mark as New
- Bookmark
- Subscribe
- Mute
- Subscribe to RSS Feed
- Permalink
- Report Inappropriate Content
Very slim. Is 8.1 + VS 2013 known to be a better configuration? I'm curious because the support page does specify my configuration as being valid:
https://software.intel.com/en-us/intel-inde-support
- Mark as New
- Bookmark
- Subscribe
- Mute
- Subscribe to RSS Feed
- Permalink
- Report Inappropriate Content
Hi Logan,
Thanks for the feedback!
In order to help us to proceed with the investigation, can you please answer these couple of questions:
- Which GFX driver version are you using? You can query the driver version through the platform info: (CODE-BUILDER > Platform Info…, right click on the GPU device under Intel(R) OpenCL platform and look for Device Driver Version property)
Have you done any installation \ uninstallation of the GFX driver before the tool stops working?
- Can you please provide the name of the platforms that you observed? How many OpenCL platforms are you observing now in total?
Thanks,
Uri
- Mark as New
- Bookmark
- Subscribe
- Mute
- Subscribe to RSS Feed
- Permalink
- Report Inappropriate Content
Hi Uri,
Sure. My GFX driver version is 10.18.10.3412.
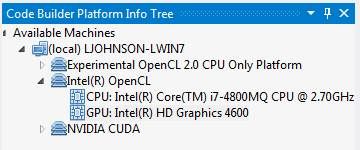
Code builder reports these platforms:
Which is what my application shows when API trace is disabled:
But when I enabled API tracing via CODE-BUILDER->OCL Debugger->Options my application shows:
If I configure my application to grab the first platform listed as Intel(R) OpenCL, API tracing does not work. If it uses the second it does. I shared a memory leak application with Robert for another issue that shows this behavior as well.
- Mark as New
- Bookmark
- Subscribe
- Mute
- Subscribe to RSS Feed
- Permalink
- Report Inappropriate Content
Logan,
The driver that you have appears dated. Could you install 10.18.14.4080 driver or something from December 2014 or January 2015 and try to see if you have the same issues?
- Mark as New
- Bookmark
- Subscribe
- Mute
- Subscribe to RSS Feed
- Permalink
- Report Inappropriate Content
Robert,
I tried, however the installer got mad about it not being verified by Dell. I grabbed the most recent version from Dell's website, which is circa August-November, with no luck.
- Subscribe to RSS Feed
- Mark Topic as New
- Mark Topic as Read
- Float this Topic for Current User
- Bookmark
- Subscribe
- Printer Friendly Page


