- Mark as New
- Bookmark
- Subscribe
- Mute
- Subscribe to RSS Feed
- Permalink
- Report Inappropriate Content
Hi,
I built a setup in April 2023 with :
- Intel Core i9-13900K
- Asus ROG Maximus Z790 Hero
- 2x32 GB Corsair Vengeance 6600 MHz
- Asus ROG 4090
- Asus ROG Thor 850 Watts
From the very beginning, I had sometimes BSODs, and several apps/games crashing very "reliably".
Even though the PC:
- Not overclocked (no XMP, so RAM is running at 4800 MHz)
- No Tweaks of any sort in the Bios / default values from Asus Bios.
- Windows 11 Pro 10.0.22621
- Windows / Drivers / Bios are up to date with latest versions as of today.
The tests :
- Prime95 : with smallest and small FFT (to only test CPU and CPU cache) -> gives FATAL ERROR (prime numbers errors) on some CPU cores after a few minutes.
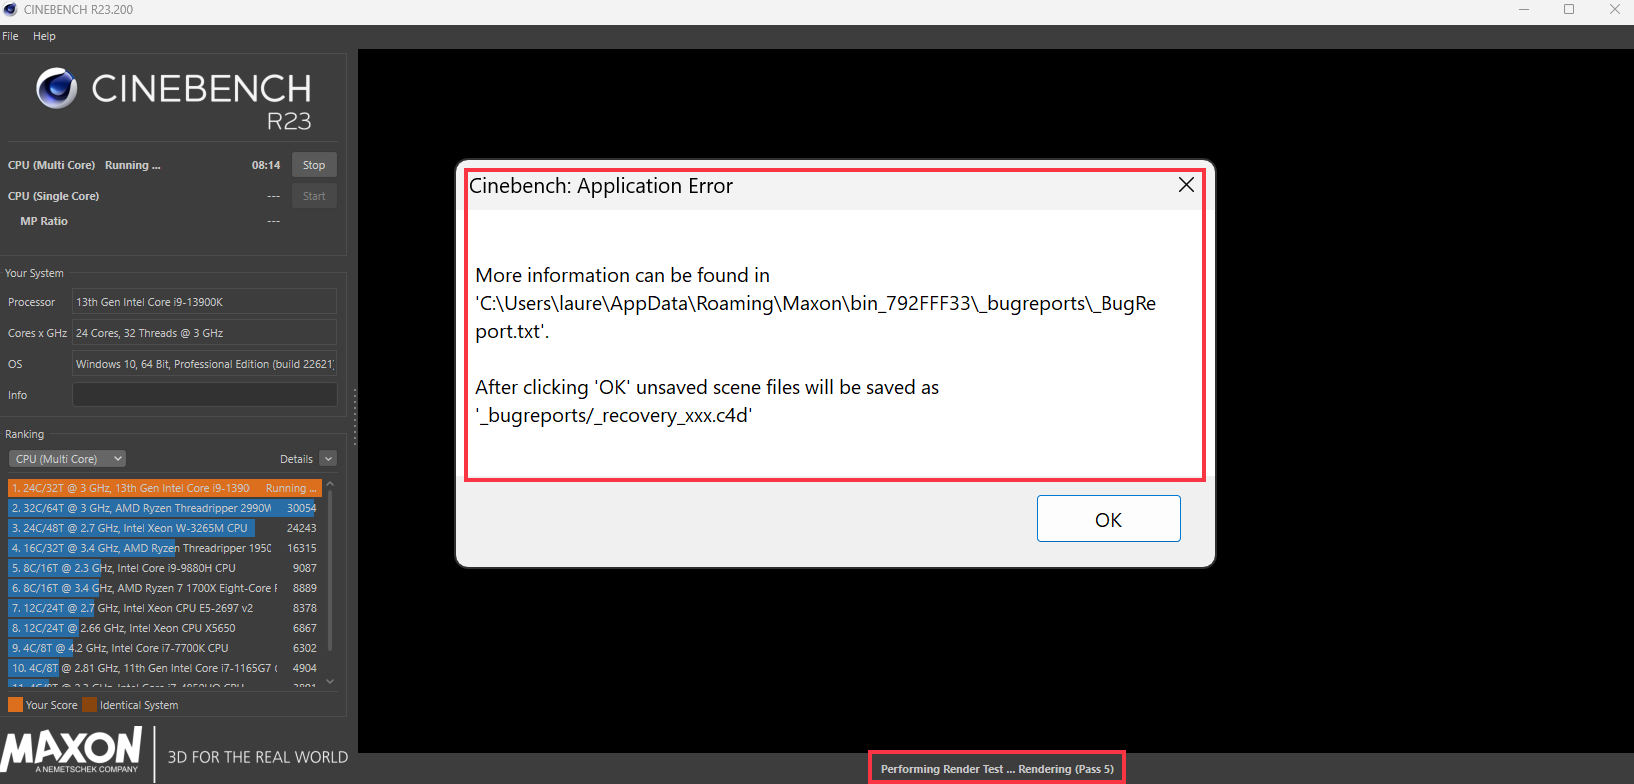
- Cinebench R23 in single core : no problem, no crash during the 10min run
- Cinebench R23 in multi-core : crashes after 2 to 30 seconds systematically.
- GPU tests are fine, they complete with no crash (Furmark)
- Memtest86 : did several runs on the mem at 4800 and 6600 -> no errors, all tests PASS.
- a few games such as Cyberpunk 2077, Horizon Zero Dawn : almost systematically crash when launched.
A couple of days ago, I realized that it's probably the CPU:
- I use an app for 3D Printing called a "slicer" who prepares the file for 3D printing that would consistently crash on my Windows 11 setup during slicing (after 5 to 10 seconds max), but not on a virtual machine installed with VirtualBox (Windows 10)
- Somebody advised me to try to set the Affinity for the CPU Cores/Threads in Windows 11.
- Also, I found a lot of reports in forums/reddit about problems with i9-13900K...
Since then, when I set the Affinity of the apps for only a few cores:
- Bambu Studio slicing fine, no crash whatsoever if affinity set to 8 first (CPU0 to CPU7)
- Cyberpunk 2077, Horizon Zero Dawn : they both run fine when affinity set to 8 first (CPU0 to CPU7), but crash as soon as I change affinity back to all cores/threads.
- Cinebench multi-core : systematically crashes no matter what subset of cores/threads I set.
Weirdly enough, I tried the Intel Processor Diagnostic Tool: it always passes, but I don't trust its results, since I've so many other apps/games crashing, and reports by people on the web...
So, I need help please with that, I can't trust my CPU even though I need my PC for work every day...
Intel SSU report attached.
Link Copied
- Mark as New
- Bookmark
- Subscribe
- Mute
- Subscribe to RSS Feed
- Permalink
- Report Inappropriate Content
Hi Deivid,
I ran 3 Intel Processor Diagnostics Tool tests with BIOS parameters:
- SVID Behavior="Intel Fail Safe" + MultiCore Enhancement = disabled-enforce all limits"
- SVID Behavior="auto" + MultiCore Enhancement = auto-let's bios optimize"
- SVID Behavior="auto" + MultiCore Enhancement = disabled-enforce all limits"
All 3 PASS according to IPDT (see attached files, filenames mention the bios settings).
Also, I recorded a YouTube video with SVID Behavior="auto" + MultiCore Enhancement = disabled-enforce all limits".
It shows that IPDT passed, but I run Cinebench R23, that crashes after 3min5sec.
Here it is : https://www.youtube.com/watch?v=bl58LTpdhb0
So, I don't understand the Intel Processor Diagnostic Tool : it finishes in 2 minutes, and primer numbers test runs for 45 seconds only.
How a stress test can run for such a short amount of time? Stress testing should be much longer to really test a CPU/cores...
Thanks in advance for your feedback
Laurent
- Mark as New
- Bookmark
- Subscribe
- Mute
- Subscribe to RSS Feed
- Permalink
- Report Inappropriate Content
Here is the screen cap of Intel Processor Diagnostic Tool that shows that Prime Numbers test runs only for 45 seconds :

- Mark as New
- Bookmark
- Subscribe
- Mute
- Subscribe to RSS Feed
- Permalink
- Report Inappropriate Content
Hi again Deivid,
As I mentioned in my previous reply, I found peculiar that IPDT would run a test in 2 minutes only.
I found the documentation for the IPDT command line tool to run Prime Numbers calculation.
So :
- I set in BIOS SVID Behaviour="auto" and "MultiCore Enhancement= disabled-enforce all limits".
- I launched IPDT command line tool Math_PrimeNum.exe and Prime95
/c/Program Files/Intel Corporation/Intel Processor Diagnostic Tool 64bit/Math_PrimeNum.exe -avx 2 -c -errstop -s 36000 -resultName /c/Users/laure/OneDrive/Bureau/PrimeNum_test_10min.txt
It seems that both crashed after almost 2 hours, see screen cap below.
What does it mean about the CPU if there is an ERROR/FATAL ERROR with those stress tests after almost 2 hours?

- Mark as New
- Bookmark
- Subscribe
- Mute
- Subscribe to RSS Feed
- Permalink
- Report Inappropriate Content
I saw a YouTube video, that you used Cinebench R23 is old, use the Cinebench 2024.1 version, and recheck it whether its crashing or not.
Two days before many motherboard manufacturers released the latest bios with microcode 0x12B for Vmin shift stability issues
- Mark as New
- Bookmark
- Subscribe
- Mute
- Subscribe to RSS Feed
- Permalink
- Report Inappropriate Content
Hello LoloWiwi, Thank you very much for sharing those details and the pictures.
We will continue with our research on this subject in order to provide the most accurate response to your inquiries about this scenario. As soon as I get any updates, I will post all the information on this thread.
Regards,
Albert R.
Intel Customer Support Technician
- Mark as New
- Bookmark
- Subscribe
- Mute
- Subscribe to RSS Feed
- Permalink
- Report Inappropriate Content
Hi Albert,
Thank you.
Also, when you get a chance, could you answer a couple of questions I asked in a previous message in this thread, please?
Here they are again:
- What does SVID Behavior really do ? It's hard to find in depth infos about the BIOS params (just very shallow explanations here and there)...
- Is it a problem with my i9-13900K that has to be slightly over-volted to be stable ? I've seen many influencers (YouTube) undervolting it for a much better heat dissipation and lower consumption, but none saying that they have to over-volt it to just have it stable...
Thank you for your help,
Laurent
- Mark as New
- Bookmark
- Subscribe
- Mute
- Subscribe to RSS Feed
- Permalink
- Report Inappropriate Content
The i9-13900K processor experiences very frequent crashes on Windows 11, affecting various applications, games, and benchmarking tools.
- Mark as New
- Bookmark
- Subscribe
- Mute
- Subscribe to RSS Feed
- Permalink
- Report Inappropriate Content
Hi Pronasit,
Interesting. Do you have any extra info about that? Are there any root causes identified for why there would be such problems on Win 11 and not Win 10?
- Mark as New
- Bookmark
- Subscribe
- Mute
- Subscribe to RSS Feed
- Permalink
- Report Inappropriate Content
I bought a 13900k and gave 128 GB RAM. I am running Ubuntu Server 23.04 and running 10s of VMs using KVM. I started experiencing random "general protection fault" kernel panics all referred to some type cross cache permission violation which I was able to fix by adding slub_debug=F in kernal parameters as suggested in https://access.redhat.com/solutions/2149041
I tried to boot into any live USB, it just crashes. It was weird. The kernel is non tainted but it crashes with the same type of permission violation in kmem_cache_alloc, and any live USB I boot even without harddisk had same issues. But with luck I am able to turn on my server, and since I have slub_debug=F added to kernel, it didn't crash during operations and it ran for weeks together.
It was working for sometime, until one day a power failure happened, and then when I restarted the server, it was saying this error I attached here. The errors before slub_debug=F showed different address in the panic, but they are all page fault errors, but I was convinced it was due to freelist pointer corruption as said by RedHat support. I suspected if its faulty RAM, so I ran memtest and it passed. This time, the error is same across different kernels. Even I tried to boot Windows in a new SSD, it couldn't boot, and I attached the BSOD here, which all points to the "general protection fault" by the processor.
But now, its panicking in the initrd phase, while the kernel is doing some udev stuffs, I am never able to find what is causing this because the logs are not recorded since the panic happens in initrd phase, there is nowhere to write them. Interestingly, the same error in the same location is happening even if I boot different kernels via live USB now. I thought I lost the server. I did memtest, it passed again. I removed each peripheral I have connected and tested, nothing helped, Until I read somewhere to use maxcpus=1 and limit the number of CPUs, and it worked, boom my computer is working. Booted up and running, but now with only one CPU. I didn't know what was wrong, until I did the same in BIOS, limited the number of cores to 1, enabling only one core in performance cores and disabled all efficiency cores. I got 2 logical CPUs due to hyper threading and it is working.
I read in a lot of places that the CPU cores are going faulty, https://access.redhat.com/solutions/3915511
Similar situation here: https://www.linuxquestions.org/questions/linux-desktop-74/not-present-page-kernel-panic-4175722803/
As said in above link, I also tried to enable the remaining cores after able to boot with only one core successfully. But I see that CPUs are getting into hardlockups or softlockups. I even tried to add softlockup_panic=0 in kernel params, its not panicing then, but just hangs forever. Its a lockup, CPU is not responding. In syslog and kernlog, I see something like this. Permission violation.
<code>
[2.911260] kernel tried to execute NX-protected page - exploit attempt?
(uid: 0)
[2.911260] BUG: unable to handle page fault for address:
fffffe00000453a8
[2.911261] #PF: supervisor instruction fetch in kernel mode
[2.911261] #PF: error_code(0x0011) - permissions violation
[2.911262] PGD 87efc6067 P4D 87efc6067 PUD 87efc4067 PMD 87efc3067 PTE
000000085fc4d163
[2.911264] Thread overran stack, or stack corrupted
[2.911264] Oops: 0011:0xfffffc000000453a8
</code>
How I came to the conclusion that individual cores are faulty?
I rolled up my sleves and moved further and enabled all efficiency cores, and only one performance core, boom the computer is working normally. Only if I enable the remaining performance cores, the kernel panic is happenning, and its the same error. I am now running good with 17 cores and 18 logical CPUs. Its running amazingly well, I am able to boot liveUSB, even able to run windows.
What is wrong here? Is an individual CPU core in performance cores has gone faulty? I didn't try experimenting with other performance cores yet since my server is back on, i want it running. I will do that experiment eventually.
Windows BSOD:
https://ibb.co/VMqTPLp
https://ibb.co/d5yKv4M
Panic in my server:
https://ibb.co/Y3Dnb84
Panics from different kernels via LiveUSB
https://ibb.co/BwxW3bw
https://ibb.co/y8mPVLB
https://ibb.co/HVwfBBP
https://ibb.co/4NJTbzS
https://ibb.co/KzFfHQh
https://ibb.co/x8WdzhJ
https://ibb.co/370Rfqb
https://ibb.co/svFbPF2
https://ibb.co/4NJTbzS
- Mark as New
- Bookmark
- Subscribe
- Mute
- Subscribe to RSS Feed
- Permalink
- Report Inappropriate Content
Can you try with another CPU ?
I read messages from people on other forums saying they switched from i9-13900K to i7-13700K and all of a sudden, problems gone.
- Mark as New
- Bookmark
- Subscribe
- Mute
- Subscribe to RSS Feed
- Permalink
- Report Inappropriate Content
Hi, I have been facing very very similar issues in the pass months, my computer is set up in late Feb 2023. To name some of the most frequent errors:
1. status access violation/status breakpoint/crash without notice in Chrome, most intensively happened when watching videos in various platforms. (it just crashed once as I was typing this reply, thank god intel has auto-saving in replys)
2. status access violation in other softwares (seen when they crash, but the error site is mostly not 0x000005 as I have seen in other cases).
3. software crashes without notice, it may not happen, but when it happen it happens very intense (like if it crashed and I open it again real quick, it will crash within seconds), e.g. League of Legends (happens both client and in-match), Cyberpunk 2077
The methods I tried:
1. Mem Test (https://hcidesign.com/memtest/download.html) All passed (Not sure if it is the best way but don't have a spare usb to install memtest86)
2. The Processor Diagnostic Tool mentioned in this thread, all passed.
3. Some other common replys when searching for "status access violation" on google, can't recall all, it happend for so long time.
My specs are as follows:
OS: Windows 10 Pro
CPU: i9-13900k
GPU: MSI 4090 Suprim X
Motherboard: MSI MPG Z790 Edge Wifi
RAM: 32GBx2 G.Skill Trident Z5 RGB Black
Storage: 2TBx2 Samsung 980 Pro
Power: MSI MPG A1000G
- Mark as New
- Bookmark
- Subscribe
- Mute
- Subscribe to RSS Feed
- Permalink
- Report Inappropriate Content
So it is not the Mother Board. I was suspecting if it was the MB, because I am using ASUS Prime Z790-P WIFI. No, thanks for clarifying, we both encounter same issues. It may be due to a faulty core. Try to go into your BIOS and disable all performance cores except one. Like only one performance cores, enable all efficiency cores, you wont experience any crashes. If its the case, replace your CPU.
- Mark as New
- Bookmark
- Subscribe
- Mute
- Subscribe to RSS Feed
- Permalink
- Report Inappropriate Content
To those who are facing the same issue as this thread,
I have found a simple test to test for the not functioning core(s) if there is really any.
The idea of the test is to run the frequently faulty application/scenarios in every single core one by one.
0. By any means (most commonly task manager), find the process name that you want to test (right click process -> properties, name can then be seen) . For example, I will test on chrome so it is "chrome.exe" (msedge.exe for edge, etc.)
1. Download and open Process Lasso (https://bitsum.com/)
2. Open Options->CPU->CPU Affinities
2.1 tick "More strictly enforce default affinities" (not sure if that has an effect but I did)

3. Limit the process to run on one core every time by enter 1.process name, 2. CPU affinity (The index of core that you wish to use, one by one from 0-31, just test for 0-15 would probably be enough to find the bad core), 3. Add rule, 4. Click ok to apply the settings.

4. Open the process you entered after the settings are applied. To check if the process is really running on one specific core, you may see on the top right corner of the Process Lasso to see a nearly full occupying green bar, indicating that it is indeed using one core, like core 8 in my case. (Some more greens here because I am running other applications too)

5. Do whatever things that most likely to trigger the errors you usually have, for example open YouTube and watch a video. Just play a video for about ten seconds is enough to tell if the core is fine in my case.
6. Close the application after testing. Go back to CPU Affinities (step 2), test for next core (double-click existing rule to modify, remember to save rule after modifing.
7. Repeat step 2-6 with every single core. Occasionally you may see the error occured, in my case it is core #4, the fifth core starting from #0 , that by simply opening YouTube in Chrome will crash it with status_access_violation/status_breakpoint. At this point I can finally confirm that this is a problem related to, if not directly casued by, the CPU (i9-13900k).
The example screencap I am posting is repeating the test on core #4 with Edge since I am using Chrome to type this reply. Same as Chrome, within seconds of opening YouTube raised status_access_violation error, refresh and instantly another status_access_violation error raised, so on and so forth.

Hope you find this useful, and possibly assure yourself that we are the victims to our CPUs all the way.
For reference, my CPU batch number is X252M104T, has the most frequent errors triggered when running applications on core #4.
Citation: Idea come from https://community.intel.com/t5/Processors/browser-occasionally-displays-a-status-access-violation-error/td-p/1457802 where the author tested the core performances by other means and used Process Lasso to limit the bad core.
- Mark as New
- Bookmark
- Subscribe
- Mute
- Subscribe to RSS Feed
- Permalink
- Report Inappropriate Content
Hi KCLam,
Thanks for the walk through, very useful indeed.
On my side, I used a simpler approach:
- Open Task Manager (Win 11)
- Go to Details
- Find the process you want to test cores on
- Right click on the process and chose "Select affinity"
- Then, select the checkboxes for threads to use (on an I9-13900K, from UC0 to UC31) --> allows to narrow down on which core is faulty.
The Intel admins in this thread are still investigating since my last message (I mentioned that IPDT - Intel Processor Diagnostic Tool, cannot be a serious test for CPUs stability since it runs many tests in 2 minutes only before finishing with "PASS"... So I found the command line tool used to test the CPU cores on prime numbers (PrimeNum.exe) and ran it from the command line for much longer and it crashed...).
Still waiting for an answer...
My i9-13900K batch num is X307K561
- Mark as New
- Bookmark
- Subscribe
- Mute
- Subscribe to RSS Feed
- Permalink
- Report Inappropriate Content
Dear LoloWiwi,
Thanks for providing an even more convenient way of testing.
Have you determined which of your CPU's cores is faulty? You mentioned that your apps run perfectly on cores #0-#7 but become problematic when using all cores. Perhaps there's just one core that isn't functioning well, causing all the issues in core range #8-#31. Identifying and disabling that core might solve the problem.
In my case, when I tested using only CPU#4, both Chrome and Edge consistently malfunctioned. Videos wouldn't play for more than a second, and most of the time, they couldn't even open YouTube. I've been working with Jupyter Notebook on Chrome since my test 5 hours ago, and no errors have occurred. My hypothesis is that the faulty core is causing all the problems, so disabling that core might be a solution.
I'll keep this in mind in the coming days and test whether disabling the faulty core can resolve my issue. It might be worth trying for you too.
P.S. Love your choice of 3D printer! (since I see your slicing app)
- Mark as New
- Bookmark
- Subscribe
- Mute
- Subscribe to RSS Feed
- Permalink
- Report Inappropriate Content
Hey KCLam,
I haven't precisely determined which core exactly (I am not sure how the mapping between setting affinity to UC0-UC31 in Windows 11 task manager and real CPU threads/core is done), since I found that crashes occur when UC8-UC12 are used, so it's good enough for me
I've reproducibly confirmed that if all threads but UC8-UC12 are used, no crashes whatsoever (cinebench, apps, games).
PS: right, I'm a 3D printing addict. You too, I guess
I noticed that slicing softwares (PrusaSlicer, Cura, Bambu Studio) are amazing at testing the CPU (heavily multi-threaded) -> I could consistently have them crashing when slicing some models in less than 10 secs -> just perfect to narrow down on the issue in a few seconds instead of having CPU stress tests running for a long time.
- Mark as New
- Bookmark
- Subscribe
- Mute
- Subscribe to RSS Feed
- Permalink
- Report Inappropriate Content
Thank you KCLam, this was super helpful!
I also have a i9-13900KF running with RTX 4090, and indeed when I tried the instructions using Process Lasso, I was able to nail it down to a problematic core #4 (starting from core#0). I have disabled core #4 for all processes using process lasso, and no longer getting constant "status access violation" errors in chrome, microsoft edge, and the likes.
Have you gotten the chip RMA'ed?
What do you suggest we do, and what have you done since your last post?
- Mark as New
- Bookmark
- Subscribe
- Mute
- Subscribe to RSS Feed
- Permalink
- Report Inappropriate Content
Hi wwwaddict,
I'm glad that it is helpful.
I've RMA'ed for a replacement 13900k from Intel, that's the only option I was given at the time. About 4-5 months after the new CPU, my new 13900k got similar crashes as the old one, and this time limiting cores one by one is not able to limit the range of cores that causes the problem, I believe there are two or more "bad" cores, or there is a cause irrelavant to single p- or e-cores, in my new 13900k. You could check the timeline of RMA and reoccurance of issue in Page 5 in this post that I have posted.
I've tried https://www.reddit.com/r/overclocking/comments/1axepvu/optimizing_stability_for_intel_13900k_and_14900k/ to limit core voltages and currents afterwards, it helped but not ultimately resolved the issue I have, I am still getting occasional status access violation in Chrome and application crashes at this moment.
My suggestion: You may first try RMA and see what RMA options Intel offers, in case they only offer 13- or 14-gen CPU replacement, or you will not be changing your MB (that leads you back to using 13- or 14-gen CPU) after they reimbushes, you should be aware of potential issues in your new CPU, as I sincerely believe they do and will exist in your new CPU. If this solution ultimately solves your CPU issue, just keep using the 13900kf you have, yes it might limit the performace of your CPU, but it also gives you stable working environmnet that no need to worry about the annoying crashes. Then wait until any ultimate solution from the Intel side that solves the issue completely (I don't think they have one right now, correct me if I am wrong.)
- Mark as New
- Bookmark
- Subscribe
- Mute
- Subscribe to RSS Feed
- Permalink
- Report Inappropriate Content
Thanks KCLam,
Yeah I have already gotten the RMA done yesterday actually, during which Dell sent a technician to replace the entire motherboard along with a new Intel i9-13900KF and low and behold still the same issue, even after a factory reset, but it went away when I launched lasso and tested the cores one by one, and yet again, even with the new chip, the problem was in fact core #4. Seems to me like a manufacturing defect of some sort affecting i9-13900 chips since there is a pattern of it being core 4.
At any rate, do you know if this issue is also widespread on the 14th gen I-9’s? I am at this point considering just upgrading to the 14th gen processor.
- Mark as New
- Bookmark
- Subscribe
- Mute
- Subscribe to RSS Feed
- Permalink
- Report Inappropriate Content
.
- Mark as New
- Bookmark
- Subscribe
- Mute
- Subscribe to RSS Feed
- Permalink
- Report Inappropriate Content
I just changed to 14th gen i9-14900K and all issues are magically gone. The server is booting up butter smooth and no panics anywhere, no lockups anywhere!!
Its the bloody i9-13900K, everyone (or a subset) who bought this is silently suffering.
Please change the CPU. Thats the only solution.
- Subscribe to RSS Feed
- Mark Topic as New
- Mark Topic as Read
- Float this Topic for Current User
- Bookmark
- Subscribe
- Printer Friendly Page