- Mark as New
- Bookmark
- Subscribe
- Mute
- Subscribe to RSS Feed
- Permalink
- Report Inappropriate Content
Hi,
I'm trying to move a Monte-Carlo Fortran program using OpenMP from Xeons to the PHI. The program scales very well on Xeons but very badly on the PHI. I've attached some plots to quantify our results. The program is not huge but the data that the threads access -- only as reads -- are several GBytes. The data are mostly contained in two arrays which are not accessed sequentially while the code is running. The plots are all normalized to the same time for one thread as the focus is on the shapes of the curves, not the absolute values.
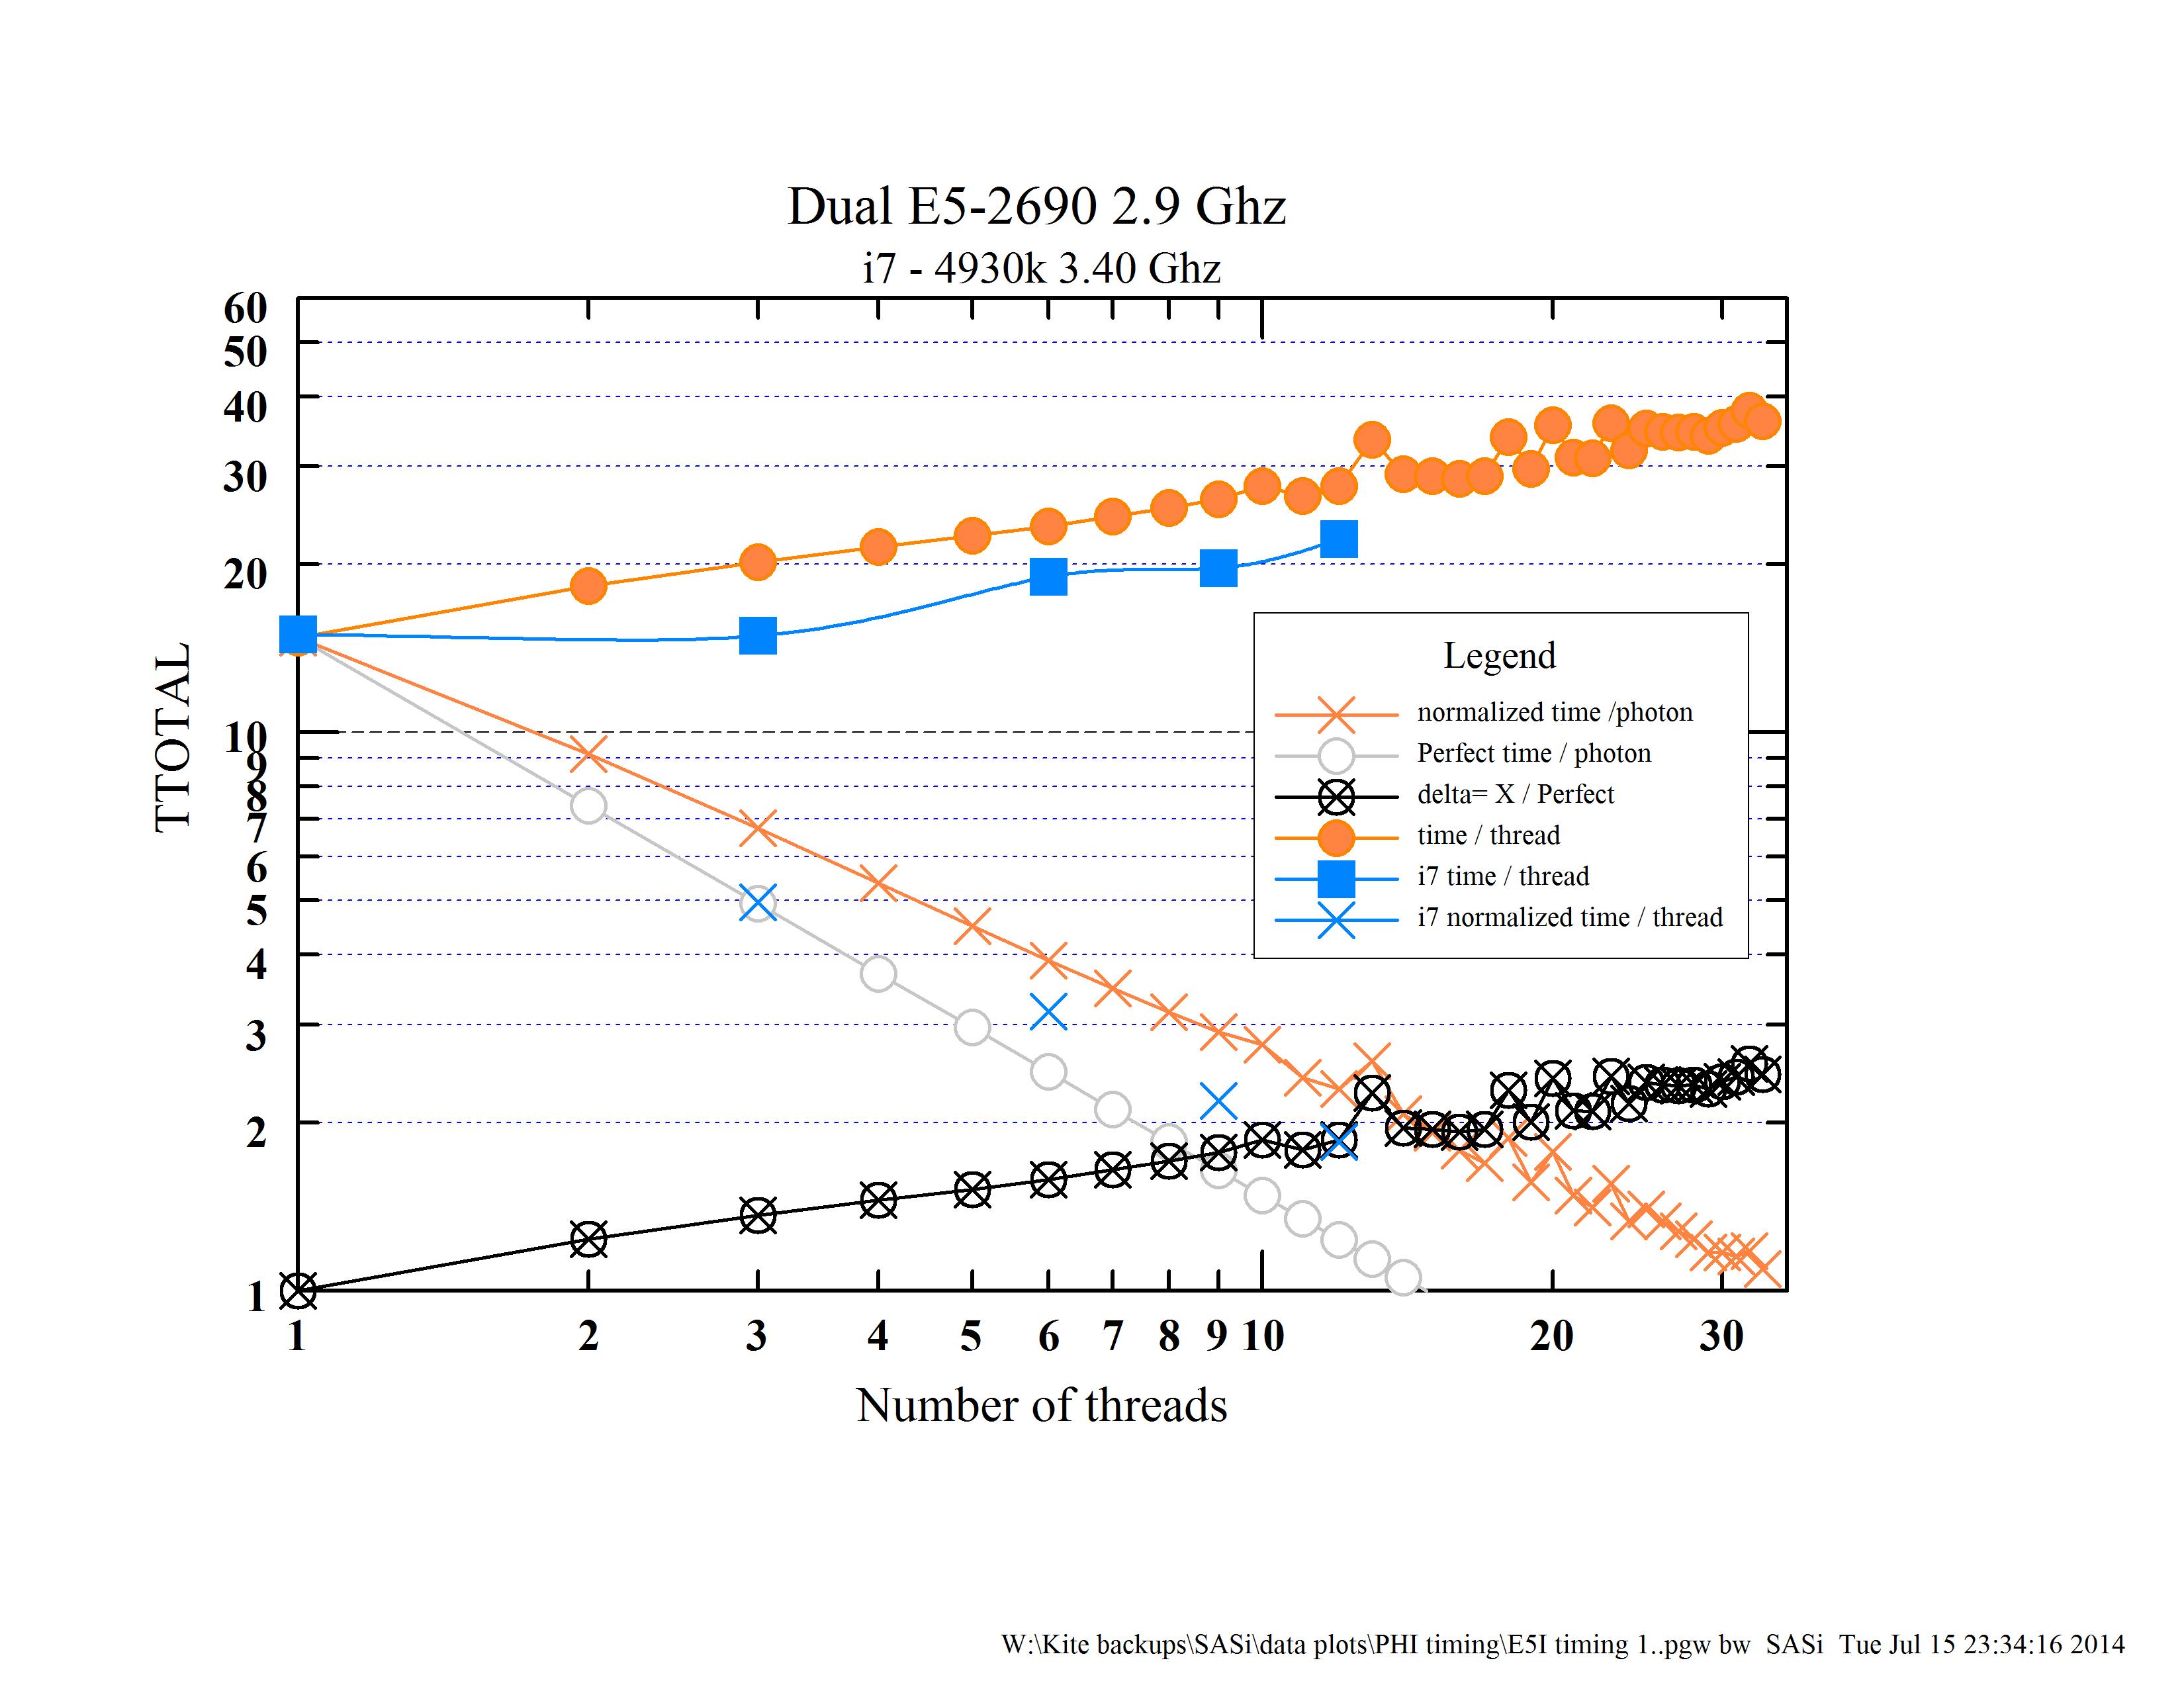
The plot "Intel Comparison plot a" summarizes the results for two Xeon computers (dual E5 w/ 32 threads & an I7 w/ 12 threads) and the PHI. The PHI is much slower than the Xeons. It starts off 20x slower for the first thread, which is not so bad but gets much worse quite rapidly. The two types of Xeons show little sign of fading, even with all the threads available on the I7 & E5 and the fact that the code is very (80%) back-end bound. The code was designed to be quite scalable (although not very vectorizable). This is shown in more detail in the E5I timing plot. The grey line shows perfect scaling and the Xeons show no sign of flattening out with the number of threads. The bumps at 13, 18 threads, and the few in the mid 20s are real, not statistical fluctuations. Don't understand those. Interestingly, the I7 is faster than the E5.
However, as shown in more detail in the "PHI timing 1" plot, at about 8 threads, the PHI results get quite flat and stay so until somewhere over 100 threads when they pick up steam again. In the end, the PHI ends up being about 100x slower than would be a Xeon with the same number of threads and using all the PHI threads is 4 - 5x slower than the 32-thread E5 setup. These results are pretty much the same no matter how we set the affinity (doesn't matter anyway, I think, as we want to run with all threads).
Our only thought so far is that there is something about the ring bus that is hosing up the access to the large arrays. We have not been able to think of a way to get around this or to decide exactly what is causing the problem way before we even get to one thread per core. We expected to get good scaling at least until we got to 56 threads. Any thoughts on this would be greatly appreciated.
thanks,
Link Copied
- Mark as New
- Bookmark
- Subscribe
- Mute
- Subscribe to RSS Feed
- Permalink
- Report Inappropriate Content
A 20:1 performance ratio between a single thread on a Xeon E5-2690 and a single thread on a Xeon Phi is quite unusual -- there are only a few attributes of the systems that show such large ratios.
Since you note that the memory accesses are not sequential, the first place to look is the memory hierarchy.
One ratio that is in this range is the random latency to arrays that fit in the 20MiB L3 cache on the Xeon E5-2690 but don't fit in the 512 KiB L2 cache on the Xeon Phi. I typically measure about 35 ns L3 latency on the Xeon E5 (Sandy Bridge) systems, which is in the 9-12 ns range (depending on the Turbo boost frequency), while L2 miss latency (i.e., to DRAM) is about 275 ns on the Xeon Phi. My measurements are on Xeon Phi SE10P systems, but other models should be close. This gives a 23x to 30x advantage to the Xeon E5. L3 cache latency on the Core i7-4930k is probably a few cycles less than on the Xeon E5-2690, which combined with the higher frequency could account for the ~23% performance advantage of the Core i7-4930k on 6 cores (as I interpret the data in figure "E5I timing 1.jpg").
Could this performance ratio could be appropriate even if the total size of the input data is much larger than the L3 cache? Yes, I think so. There are very significant differences between the L2 hardware prefetch engines on the Xeon E5/Core i7 and the L2 hardware prefetch engine on the Xeon Phi. I discuss some of the attributes of the Xeon Phi prefetcher in the forum thread at: https://software.intel.com/en-us/forums/topic/517716, but it appears to be a simple prefetcher that can only detect strides of 1 or 2 cache lines (on up to 16 different 4KiB pages).
I don't think that the L2 prefetchers on the Xeon E5 and Core i7 have been fully described, but from my experiments it appears that they will treat *any* two accesses into a 4KiB page as defining a "stream", and will immediately prefetch up to two cache lines along the (assumed) stride (provided that the computed addresses to be prefetched remain in the initial 4KiB page). Despite its name, the "L2 prefetcher" does not automatically prefetch into the L2 cache. It does automatically prefetch into the L3 cache, and sometimes also prefetches into the L2 cache, depending on how many outstanding demand loads are in flight, how many L2 misses are in flight, and other factors that are alluded to vaguely, rather than actually documented. This L2 hardware prefetch behavior is *extremely* aggressive, and makes it very difficult to load more than a few items per 4 KiB page without having many of them automatically prefetched. So if the "non-sequential" access pattern has enough locality to have multiple accesses before overflowing the stream tracker (which can track up to 32 streams of data accesses), but not enough locality to activate the much more primitive hardware prefetcher on the Xeon Phi, then much of the data will end up in the L3 cache on the Xeon E5 and Core i7, making the L3 latency vs memory latency comparison appropriate.
A few experiments with Intel's VTune (or with other performance monitoring tools) should be able to show whether this hypothesis makes any sense. If I am correct, then the code will show a high L3 load hit rate on the Xeon E5 and Core i7 and a high L2 load miss rate on the Xeon Phi.
- Mark as New
- Bookmark
- Subscribe
- Mute
- Subscribe to RSS Feed
- Permalink
- Report Inappropriate Content
Hi John,
This makes a certain amount of sense as, on a per thread basis, the access to the two large arrays is somewhat locally random but not globally. That is, while the whole data array is Gbytes, a thread is progressing through it with a window of about a hundred or so KBytes. However, the thread's windows slowly drift apart.
We'll try to test your hypothesis. Thanks, Bruce
- Mark as New
- Bookmark
- Subscribe
- Mute
- Subscribe to RSS Feed
- Permalink
- Report Inappropriate Content
Intel compilers for MIC incorporate facilities to add software prefetch
https://software.intel.com/sites/default/files/article/326703/5.3-prefetching-on-mic-5.pdf
which would be essential to competitive performance on Intel(r) Xeon Phi(tm), in case the accesses don't fall at regular intervals no further apart than alternate cache lines, when you might get benefit from hardware prefetch, as John described.
Your comments about the ring cache organization seem to imply that you expect data fetched by cores to be consumed by other cores. It's true that data can be copied among cores faster than from memory, but it's probably preferable to prefetch data to the core which will require it. Cache data sharing among threads on the same core should be more efficient than between cores.
- Mark as New
- Bookmark
- Subscribe
- Mute
- Subscribe to RSS Feed
- Permalink
- Report Inappropriate Content
Are you perhaps using a serializing random number generator?
If so, replace it with a non-serializing, thread-safe random number generator.
Jim Dempsey
- Mark as New
- Bookmark
- Subscribe
- Mute
- Subscribe to RSS Feed
- Permalink
- Report Inappropriate Content
Jim:
We're using a VSL routine to generate separate streams for each thread. Each stream is seeded differently & each thread takes from its own puddle of random numbers until the puddle has to be refreshed. I think that meets your suggestion.
--Bruce
Tim:
I was worried that the core might be wasting a lot of time searching the ring buffer before going out to memory. Are you suggesting that, in Fortran, there is a way to specify anything about where to look for the data? After a few minutes, the data become incoherent between cores.
What I don't understand is the shape of the PHI efficiency curve. It starts out well behaved for a few threads; then becomes so flat that little is gained by adding more cores until, when it starts to reach a large number of cores, the productivity starts to increase as more cores are added. This has to be an important clue (esp. the later improvement) to the nature of the speed problem.
Bruce
- Mark as New
- Bookmark
- Subscribe
- Mute
- Subscribe to RSS Feed
- Permalink
- Report Inappropriate Content
If a cache line has been modified, it would need to be prefetched after modification to accelerate its availability to another core, including updating memory. Are you expecting false sharing?
- Mark as New
- Bookmark
- Subscribe
- Mute
- Subscribe to RSS Feed
- Permalink
- Report Inappropriate Content
The cache coherence protocol is directory-based, with cache line addresses hashed to one of 64 Distributed Tag Directories (DTDs) around the ring. On an L2 cache miss, the physical address is used to compute the DTD number (using an unpublished hash function) that owns the address and the read request is sent to that DTD. The DTD keeps track of whether any other cores have a copy of the cache line and will request a cache-to-cache transfer if the data is available. Note that Xeon Phi will do cache-to-cache transfers of clean data as well as dirty data. This is not a very common feature of recent processors, but it does reduce the demands on the memory controllers.
If the data is not in another cache, the DTD uses the physical address to compute the memory controller number that owns the address and sends the read request to that memory controller. The mapping of physical addresses to memory controllers is not trivial if ECC is enabled, since the system reserves 2 cache lines out of every 64 cache lines to hold the error-correction bits. On my Xeon Phi SE10P processors, memory is interleaved around a fixed (unpublished) permutation of the 16 memory controller channels in 62-cache-line "chunks", starting at address zero and going all the way to the top of memory.
Average latency depends on the relative position of the requesting core, the DTD, and either the responding core or the responding memory controller. There is not much difference in the average latency for loads sourced by another cache and loads sourced by memory -- my measurements are about 275 ns and 280 ns, respectively. The cache-to-cache transfers seem to show a much larger variability than the memory transfers, with smaller "best-case" values and higher "worst-case" values. The specific values depend on the relative core numbers and the address being accessed (which determines the DTD being used). For contiguous transfers the DTDs bounce all over the place, so the average value is appropriate.
- Mark as New
- Bookmark
- Subscribe
- Mute
- Subscribe to RSS Feed
- Permalink
- Report Inappropriate Content
False sharing: we did worry about false sharing since all the threads write their results to a single, relatively modest size [100KB] array, However, if we run the code w/o that line of code, we see no improvement in times.
John: I interpret what you're saying that finding data in the ring buffer is as expensive as going to memory. I guess we don't know how long it takes to find out it isn't in the buffer (cache to cache transfer candidate) and then go to memory. If this is large and our main data array is large compared to the buffer, that becomes a fixed cost, on average, to a simple memory access. humph!
I gather that Knights Landing will handle this problem in some way I have not been able to find the details of yet.
--Bruce
- Mark as New
- Bookmark
- Subscribe
- Mute
- Subscribe to RSS Feed
- Permalink
- Report Inappropriate Content
A large fraction of the average memory latency is due to hopping from the core to the DTD to the memory controller, etc, but this is the way the chip works -- there is no provision for a "bypass" path going straight to memory (which would be a variable distance anyway, since the 8 memory controllers are distributed around the ring). A core would not even know which memory controller to ask for the data, since it works with contiguous physical addresses and these don't need to be converted to the non-contiguous addresses needed to access memory until after the DTD has determined that none of the caches has a copy of the cache line in question.
Much of the transaction path for cache-to-cache interventions and memory accesses is the same, and the parts at the end that differ end up having average latency that is dominated by hops on the ring and slight differences in required transactions, so DRAM latency ends up being a negligible portion of the total load-to-use latency. GDDR5 DRAM latency for an open-page read is ~12 ns, which is less than 5% of the total latency.
- Mark as New
- Bookmark
- Subscribe
- Mute
- Subscribe to RSS Feed
- Permalink
- Report Inappropriate Content
Hi,
So, in my case with an array that is much larger than the ring bus, memory access is going to be significantly slower than just going to memory? And it is part of the fundamental hardware design and there is no way around this issue?
ugh!
- Mark as New
- Bookmark
- Subscribe
- Mute
- Subscribe to RSS Feed
- Permalink
- Report Inappropriate Content
Memory latency is bounded below by cache coherence protocols on many systems. Xeon Phi has a bit more trouble with it than mainstream processors because there are so many cores that a relatively complex directory-based coherence protocol was required. There are several well-known approaches to reducing these latency overheads that are likely to be applied to Knights Landing, but basic physics suggests that having lots of relatively low-frequency processors on a chip is going to have a higher cost for cache coherence than having a small number of relatively high-frequency processors on a chip. So it will get better, but there will always be some overhead for enabling scalability.
I have not run across any other codes that show a 20:1 performance ratio in favor of the mainstream processors -- most codes show single-thread performance ratios that are more like 4:1 (with a lot of variability, of course), making it much easier for the Xeon Phi to use scalability to catch up with (and often pass) the performance of the mainstream chips.
- Mark as New
- Bookmark
- Subscribe
- Mute
- Subscribe to RSS Feed
- Permalink
- Report Inappropriate Content
I had expected about a 2x improvement compared to a pair of fast E5s. This was worthwhile as the code takes E5 thread-days to -weeks to run. Only this modest amount because the code does not lend itself to vectorization. We find that for small test programs, the PHI performs more or less as expected.
Still, I'm most confused about the change in performance slope of the PHI after about 100 threads where it starts to get better again. As you can see on the PHI timing graph, the time/photon -- the basic measure of performance for this code -- and even the time/thread starts to improve. In fact, the slope becomes better than 'perfect'. Those curves are from scattered or balanced affinity-- they seem to produce the similar results. We have yet to try compact, which, if caching is to help rather than hinder, may show some improvement.
--Bruce
- Mark as New
- Bookmark
- Subscribe
- Mute
- Subscribe to RSS Feed
- Permalink
- Report Inappropriate Content
>> because the code does not lend itself to vectorization
While this may be true for the code as it is now, it is not necessarily true for the data and process which needs to be performed. This might be more of a case of the programmer does not lend himself to vectorization.
I can imagine that this code has its roots decades ago, while the investigation then as to recode for 2-wide/4-wide vectors may have yielded a "not worth the effort" result, the same analysis with 8-wide/16-wide vectors may yield a completely different result. You have a lot of headroom for code complexity verses performance, assuming more complex coding will be required on the front-end and back-end for conversions of data formats. 2x more work may yield ((8-wide/16-wide)/2)x better performance (4x or 8x). Even at 4x more work you could potentially return 2x to 4x more performance. If you can then eliminate the data format conversions, then you can recoup additional performance.
Jim Dempsey
- Mark as New
- Bookmark
- Subscribe
- Mute
- Subscribe to RSS Feed
- Permalink
- Report Inappropriate Content
A vast majority of benchmarks I've seen rely on combined vectorization and threading to enable MIC to out-perform host. Even in my least favorable cases (outer loop vectorization), vectorization produces a speedup over non-vector threading of 2x on AVX host and 3x on MIC. Prior to introduction of AVX and OpenMP 4, there wasn't enough potential gain for compilers to support all of these vector-parallel modes. Even now, non-Intel compilers don't always reflect such optimizations.
MIC to some extent is a deja vu situation in that it relies on engaging top notch compiler technology to deliver useful performance. Compilers have come a long way since Itanium bet on such a proposition, and MIC was less of a departure from established IA architecture, by the time it was introduced. It's still a situation where marketers may minimize their portrayal of the effort involved; the program optimization effort should usually be less than e.g. with CUDA, yet not so often negligible. Part of the sales proposition is that current compiler technology enables more of that effort to pay off on host or future CPUs, in the event that the value of MIC turns out to be short-lived.
- Mark as New
- Bookmark
- Subscribe
- Mute
- Subscribe to RSS Feed
- Permalink
- Report Inappropriate Content
The primary reason that it does not lend itself to vectorization is that future events depend on the results of current events. Each stream of events is independent of the others, which makes it excellent for OpenMP parallel code -- you'll notice on the graph that running 32 threads on a pair of E5s shows no sign of flattening out. I believe that, short of problems like the ring buffer, the only limitation is accessing the very large array the program needs to perform. The slowest parts of the code are an evaluation of a polynomial, which is done in the registers and takes about 1/3 of the time, and an integration with an uncertain limit which takes nearly 2/3 of the time. The integration is dominated (over half) by memory access time of three values from the afore-mentioned large array. We have tried to vectorize the integration but the aggressive step-size predictor we've been using in the non-vectorized version continues to be faster.
So far, it seems what we need is lotsa processors with fast memory access into a multi-GByte array of precomputed values.
- Mark as New
- Bookmark
- Subscribe
- Mute
- Subscribe to RSS Feed
- Permalink
- Report Inappropriate Content
Is your code postable for comment from viewers of this thread?
Jim Dempsey
- Mark as New
- Bookmark
- Subscribe
- Mute
- Subscribe to RSS Feed
- Permalink
- Report Inappropriate Content
Hi Jim,
It's long & has lotsa pieces; however, we do know the part that is taking all the time. I've attached the amplifier printout of the non-vectorized version (it is faster than the vectorized case) from a Xeon run. The PHI version has a similar time distribution. Line 1674's time is taken up with the H function call, half the time of which is just taken up with the call. H just calculates a polynomial. It actually takes relatively less time in the PHI. In any case, the question is why does it have such bad performance in the PHI compared to the Xeon. Datinlns is the very large array. I'll double check on Tuesday to confirm the fact that the relative time distributions between the Xeon & the PHI are comparable but you asked to see the code.
--Bruce
- Mark as New
- Bookmark
- Subscribe
- Mute
- Subscribe to RSS Feed
- Permalink
- Report Inappropriate Content
The profile isn't very useful when you don't show contents of the time-consuming in-lined functions. If the usual suggested build option -debug inline-debug-info doesn't resolve that, I would suggest -fno-inline-functions for profiling.
Polynomial and integrations may offer opportunities for vectorization if there is opportunity for parallel evaluations.
- Mark as New
- Bookmark
- Subscribe
- Mute
- Subscribe to RSS Feed
- Permalink
- Report Inappropriate Content
Hi Tim,
Once again, Intel seems to have lost my reply. There is only one in-line function: H. It is pretty much as efficient as it is going to get. The datinlns (x,y,z) are not functions, they're array lookups. Unfortunately, the workarounds we have to do to get PHI to do offload in Windows Fortran prevents us from running amplifier in debug mode and seeing what the breakout of time consumption is.
But this is not the most important issue. The issue is, if the same code runs well on a Xeon, why does it run so incredibly slowly on the PHI? Our L1 cache hit rate is 97% but the misses pretty much all fall through to memory and the estimated latency impact (is this a relative time?) is about 900. Which probably makes our problem the 3% we don't find in the ring buffer.
--Bruce
- Mark as New
- Bookmark
- Subscribe
- Mute
- Subscribe to RSS Feed
- Permalink
- Report Inappropriate Content
Also, if you can include the source, it is much easier to read (and comment if necessary).
Is datinlns a function or array?
Also, you reference
datinlns(ln, izkm, 4), datinlns(ln, izkm, 5), datinlns(ln, izkm, 3), datinlns(ln, izkm, 1)
in the same iteration.
You would have much higher L1 cache hit ratio if you place the property of the particle first.
datinlns(4, ln, izkm), datinlns(5, ln, izkm), datinlns(3, ln, izkm), datinlns(1, ln, izkm)
indexes 3,4,5 are used predominantly. All three of those would have a good probability of residing in the same cache line, and for when they are not, they will be residing in adjacent cache lines. By changing subscript order you would convert 3 cache misses into either: a) one cache miss, 2 L1 cache hits, or b) 2 cache misses and 1 L1 cache hits.
my guess is
line 1,661 22.359s (no change)
line 1662 1s
line 1668 1s
This change alone might reclaim ~40-42 seconds when all three reside in same cache line (12/16 for random distribution) and save you ~22s when split (and when hardware prefetcher did not aid you).
If you also rearrange your code such that the reads of dadinlns are in ascending index order (3, 4, 5 in this case), the hardware prefetcher my provide further improvements.
Can you show what is in function H?
Jim Dempsey
- Subscribe to RSS Feed
- Mark Topic as New
- Mark Topic as Read
- Float this Topic for Current User
- Bookmark
- Subscribe
- Printer Friendly Page