- Mark as New
- Bookmark
- Subscribe
- Mute
- Subscribe to RSS Feed
- Permalink
- Report Inappropriate Content
Since I upgraded my Macbook Air to Intel XDK 3491 release, debugging is impossible (with new Simulate Tab).
Running the project in the Simulator is working without limitation or faults but when I start debugging, the Simulate Tab and the XDK freezes (no interactions possible anymore).
I tried nearly everything but nothing helped. I re-started my project from scratch, re-imported the html5 code and setup my cordova plugins again. And I removed XDK totally from my laptop and tried a fresh, new installation (instead of an update). But nothing helped. I think this has something to do with the cordova error messages showing up in the Simuator now. It worked one or two time at the very beginning, but I saw that with every run the number of errors doubled. Because I use a lot of plugins in this bigger project, the number of errors grow very fast (>100). Then with the 3rd run I guess, it stopped working, the Simulator and XDK freezes at debugging start and nothing left other than killing the XDK process (although XDK process is NOT marked as "not responding" by OSX).
With every new release since the Emulator was replaced with the new Simulator I hope that this problem disappears, but it wasn't the case till now.
Thanks god, I still have installed the last version of XDK with emulator tab (I guess it was 3400 release) on my iMAC. So I pray not to push the upgrade button at startup by default some day, because this is the only computer I still can work with XDK and debug my code.
Any solutions for this problem? If not, where can I download the last Emulator Release. I would appreciate to go back to this version as a work around! Because developing software without appropriate and easy debugging features is horrible.
Thanks a lot!
Mikel
- Tags:
- HTML5
- Intel® XDK
Link Copied
- Mark as New
- Bookmark
- Subscribe
- Mute
- Subscribe to RSS Feed
- Permalink
- Report Inappropriate Content
Mike -- sorry, but we only support the last two releases of the product. Since you're on a Mac, you can make a "duplicate" of your 3400 install for safe keeping:
- open Finder
- goto the /Applications folder
- right-click the /Applications/Intel XDK.app folder
- select "Duplicate"
- rename the duplicate folder to something like "XDK-3400.app"
Now, start the new duplicate copy of the XDK and:
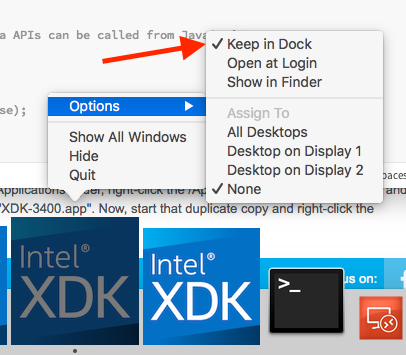
- right-click the dock icon
- choose "Options" from the right-click menu
- select "Keep in Dock" (see image below)
At this point you can safely download (from http://xdk.intel.com) and install the latest version of the XDK into the standard /Applications/Intel XDK.app location, and your old version will remain unchanged on your disk. Do not run two copies of the XDK at the same time, it will cause problems.
p.s. The XDK will appear as "node" or "nw" in the process list. Usually multiple processes will be shown with either "node" or "nw" as part of the name.
- Mark as New
- Bookmark
- Subscribe
- Mute
- Subscribe to RSS Feed
- Permalink
- Report Inappropriate Content
Paul, thank you very much for your support and this easy to follow step by step instructions!
Good to know, that I can keep my version save like this!
I really appreciate your work and the Intel XDK!
You give us developers great possibilities for free, wich is often not prized enough!
Thanks!
- Mark as New
- Bookmark
- Subscribe
- Mute
- Subscribe to RSS Feed
- Permalink
- Report Inappropriate Content
I have the same problem in version 3641 for windows.
Not generally though. It's just one project. When I activate debug the XDK freezes. In the tasklist one of the nw.exe's seem to use up all ressource for one of the 4 cores (25% cpu). The only thing I can do is to kill it in the task list.
Since you plan to eliminate USB debug (didn't I read that somewhere?), then I would be left with an undebugable app.
Given that It works for other project than this particular project seems to me like a very good oppertunity to find out what wrong.
If you have access to my code it's the FotoAppJQ app.
- Mark as New
- Bookmark
- Subscribe
- Mute
- Subscribe to RSS Feed
- Permalink
- Report Inappropriate Content
Lars -- as an alternative, while the Debug tab is still functional, you can try that. Otherwise, I recommend you review this doc page for your debug options > https://software.intel.com/en-us/xdk/docs/intel-xdk-debug-and-test-overview <
The Simulate tab cannot resolve all issues, thus you sometimes have to use other methods. One easy method is to open your index.html file in a browser and use the debugger in your browser. That approach will not work with your calls to Cordova API calls, but it can provide insight into some issues that other methods cannot.
- Mark as New
- Bookmark
- Subscribe
- Mute
- Subscribe to RSS Feed
- Permalink
- Report Inappropriate Content
Thanks :-)
Just tried the Remote Chrome (CDT) debug option, and it works a treat.
Nice to know that I will not be left in the dark when the Debug tab is removed :-)
- Subscribe to RSS Feed
- Mark Topic as New
- Mark Topic as Read
- Float this Topic for Current User
- Bookmark
- Subscribe
- Printer Friendly Page
