- Mark as New
- Bookmark
- Subscribe
- Mute
- Subscribe to RSS Feed
- Permalink
- Report Inappropriate Content
Hello All,
We have multicore/multithread application media-intensive software developed with IPP and we are using intel compiler with AVX optimization enabled. We also have a JDK ( 1.8.0_181-b13) installed and a Java code to handle the signaling and control operations of media applications running on C/C++. This is done through JNI running on other cores.
On Rhel 6 our application runs with constant CPU usage at a fixed load testing. But on Rhel 7 we are seeing for 1st one hour or so (sometimes it takes 2 hours) the CPU usage is high. And post that without any change the CPU usage is coming down by 5-10%. Initially, we thought it is caused by "TUNED" but even uninstalling tuned. and we are using the default rhel kernel (3.10.0-957.el7.x86_64).
We are using Intel Xeon CPU[Intel(R) Xeon(R) Gold 6132 CPU @ 2.60GHz ] with 2 Sockets and multiple CPUS[ ProLiant DL380 Gen10 ]. Our product/application is running on a bare-metal server. Not in any VM or KVM.
The OS is Vanilla RHEL 7.8 .
We are using numcatl cores and the product is pinned on 3 cores in NUMA 1. The cpupower.service is not running in our server. The Intel P_state and C_State drivers are not installed. Turbo Boost is disabled. The nohz_full and CPU isolation is disabled in our setup The irqbalance service is running in default mode. The /proc/sys/vm/ data is restored to default OS values after the uninstallation of TUNED. Spectre Meltdown patches are applied. Any clue or help will be highly appreciated.
Thanks
Soumit
- Tags:
- performance
- Rhel 7.8
Link Copied
- Mark as New
- Bookmark
- Subscribe
- Mute
- Subscribe to RSS Feed
- Permalink
- Report Inappropriate Content
Can you run Intel VTune hotspots analysis?
Run at least a 10 such a analysis in order to observe a results variation.
- Mark as New
- Bookmark
- Subscribe
- Mute
- Subscribe to RSS Feed
- Permalink
- Report Inappropriate Content
I have forgotten to add, that you may restrict the count of events either to kernel mode code or to user mode code and look at the resulting hotspots.
I do not recommend to measure both user mode and kernel mode count overflow. By my own observation the perf-driverless activity in the kernel mode is very large and will skew the results.
- Mark as New
- Bookmark
- Subscribe
- Mute
- Subscribe to RSS Feed
- Permalink
- Report Inappropriate Content
Hello,
Thanks for replying to this thread. And suggesting using Vtune. We are trying but we are facing some issue when we try to capture hotpot data with target PID. We are trying to resolve that.
We are new to Vtune, we are looking into documentation, if you can suggest how to enable/disable event counting for Kernel/User space will be of great help.
Regards,
Soumit
- Mark as New
- Bookmark
- Subscribe
- Mute
- Subscribe to RSS Feed
- Permalink
- Report Inappropriate Content
Hello,
You may create a *custom analysis and open the EVENT drop-down menu, then choose either: USER or OS.

Run at least a 10 times the same analysis and observe the results (there may be a variations) in some performance metrics reported by the VTune.
We are trying but we are facing some issue when we try to capture hotpot data with target PID.
If possible try to run your executable under the VTune control.
*of course this is relevant to hotspot analysis also.
- Mark as New
- Bookmark
- Subscribe
- Mute
- Subscribe to RSS Feed
- Permalink
- Report Inappropriate Content
I have forgotten to add this response.
If you are allowed you may share the results with us of course.
- Mark as New
- Bookmark
- Subscribe
- Mute
- Subscribe to RSS Feed
- Permalink
- Report Inappropriate Content
Hello
we are able to get the Performance snapshot. I will need to check with legal to share in community the capture.
But when we try to capture the hotspot analysis, we end up having the error due to PIN_MAX_THREADS. Can you please let us know if this can be bypassed? or configure, we could not find any details for this.
Pasted the effor
- Mark as New
- Bookmark
- Subscribe
- Mute
- Subscribe to RSS Feed
- Permalink
- Report Inappropriate Content
>>>But when we try to capture the hotspot analysis, we end up having the error due to PIN_MAX_THREADS. Can you please let us know if this can be bypassed?>>>
You should ask for help on Intel VTune forum.
I have never (as a VTune user) encountered the problem described in your response.
- Mark as New
- Bookmark
- Subscribe
- Mute
- Subscribe to RSS Feed
- Permalink
- Report Inappropriate Content
Hi,
We have been able to capture Hardware based hotspots and we are trying to analyze the sample.
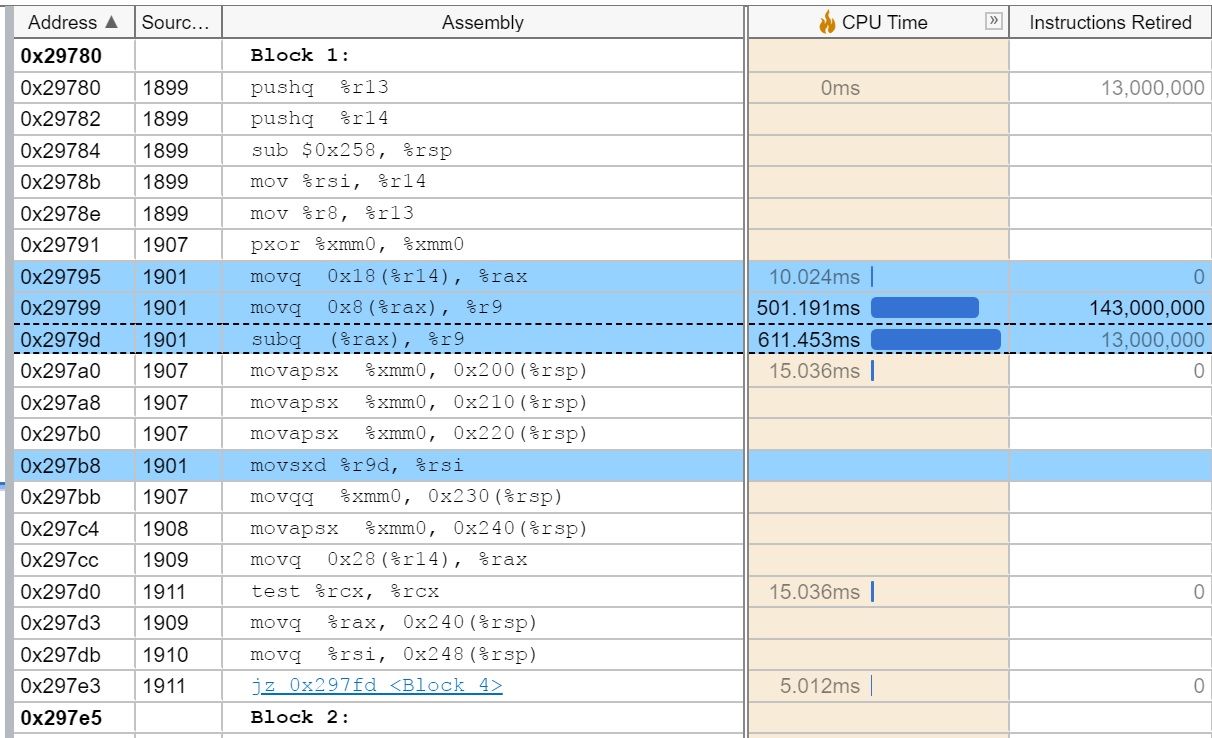
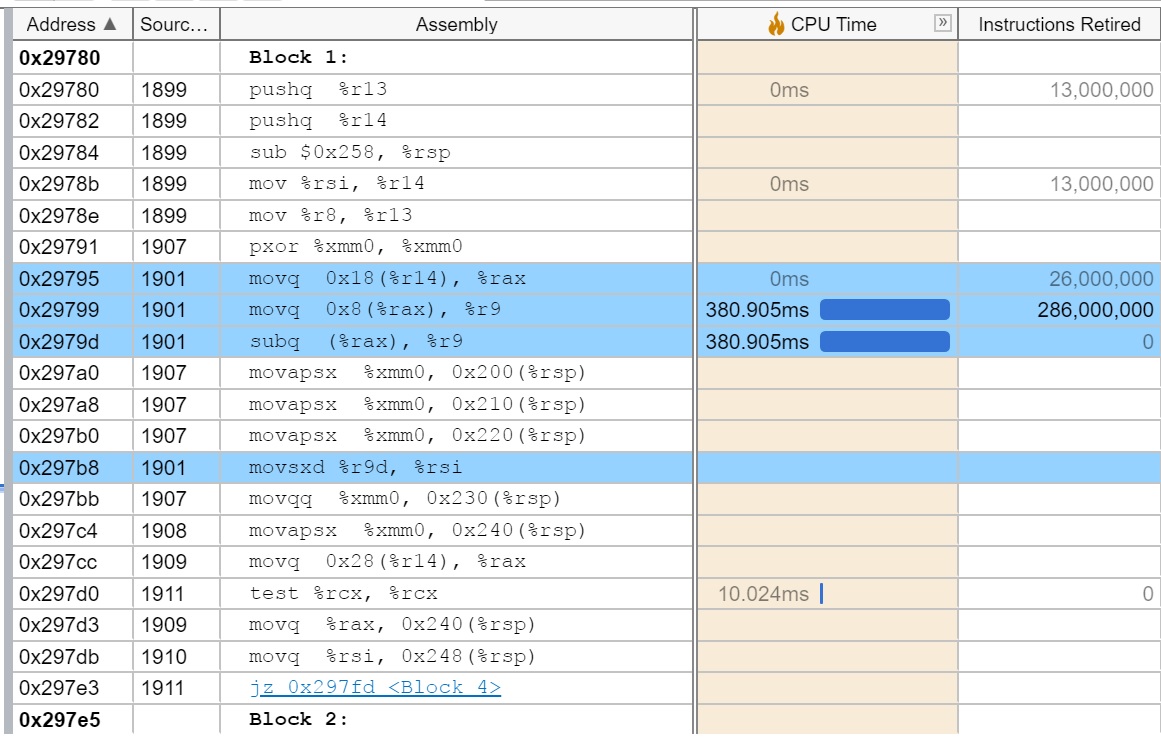
We found that the same section of code is utilizing different amount of CPU time after the process if getting executed for 1 hour or a little more. Until then, the CPU usage is higher.
And we need a little help from you regarding what can be the possible cause for the same. I am attaching the assembly analysis screenshot from when the CPU usage is higher and low. It includes the CPU time and the instructions retired numbers.
Can you please help us little on the possible reason for the same.
Thanks and Best Regards.
- Mark as New
- Bookmark
- Subscribe
- Mute
- Subscribe to RSS Feed
- Permalink
- Report Inappropriate Content
By looking at assembly I presume that attached part of the code may be executed by some loop (at the higher level).
There are two arguments loads into %r14 and %r13 (possibly pointers?) and later there is a possible "pointer chase" like machine code sequence. I suppose, that high number of retired instructions and CPU time spent may be related to ineffective caching of the pointee data. The code at addresses 0x29795, 0x29799 and 0x2979d is probably executed serially and represent some kind of data structure manipulation. The code at 0x297b8 is dependent on result at 0x2979d (hence it was marked by the VTune).
It is interesting how much the issue of skid skewed the results. VTune pre-configured "hotspot analysis" relied on "INSTR_RETIRED.PREC_DIST" and for large number of loop iterations or other lengthy hot code the convergence is high and hence precision of results is more accurate.
It is hard to know exactly what has happen without seeing the whole picture presumably at source level and without an additional samples of other performance events (cache-hierarchy related).
- Mark as New
- Bookmark
- Subscribe
- Mute
- Subscribe to RSS Feed
- Permalink
- Report Inappropriate Content
Can you show the source code implementation?
- Mark as New
- Bookmark
- Subscribe
- Mute
- Subscribe to RSS Feed
- Permalink
- Report Inappropriate Content
Hi Bernard,
I am checking whether I can do that. I will get back on the same.
In the meantime, if you have any other suggestions, please let me know so.
Thanks & Best Regards
- Mark as New
- Bookmark
- Subscribe
- Mute
- Subscribe to RSS Feed
- Permalink
- Report Inappropriate Content
If you are allowed, then you can post the whole disassembly of the hotspot function (and not a single code fragment).
>>>In the meantime, if you have any other suggestions, please let me know so.>>>
Any other suggestions will require a custom analysis mainly based on the cache-memory performance measurements.
- Mark as New
- Bookmark
- Subscribe
- Mute
- Subscribe to RSS Feed
- Permalink
- Report Inappropriate Content
Hi Bernard,
Here is the attached disassembly of the hotshot function.
We will try try a cache-memory analysis and let you know if we need a little help.
Thanks & Best Regards
- Mark as New
- Bookmark
- Subscribe
- Mute
- Subscribe to RSS Feed
- Permalink
- Report Inappropriate Content
- Mark as New
- Bookmark
- Subscribe
- Mute
- Subscribe to RSS Feed
- Permalink
- Report Inappropriate Content
Hi @Bernard ,
Analyzing a bit more we got a lot of system calls as well as JVM calls and a lot more which are using a little less CPU time for similar sized captures while our CPU usage is high and low respectively.
I am attaching an excel file for that highlighting the differences. Please let me know if you can shed a little more light on what can be the possible reasons for the same.
Thanks & Best Regards,
Arnab
- Mark as New
- Bookmark
- Subscribe
- Mute
- Subscribe to RSS Feed
- Permalink
- Report Inappropriate Content
Sorry for long delay, I was overloaded by my work and my own projects.
In regards to results_comparison file I can see a lot of kernel mode activity. In this case it is unknown to me if VTune hotspot analysis was configured to sample both in kernel and user mode. I would prefer to see (if possible) a comparison of user mode only hotspot analysis and kernel mode only hotspot analysis. This is needed to clearly asses the dominating contribution of kernel mode activity.
There are visible a zero results which are quiet improbable and those should be either filtered out or may be averaged over longer runs or maybe collected more samples may be collected (more test runs).
Now in case of results itself the dominating hotspot functions both in time and retired instructions domain are:
--
| func@0xffffffff81136eab | 1.77923 | 6695000000 |
| system_call_after_swapgs | 4.4606 | 559000000 |
| audit_filter_syscall | 3.97945 | 15366000000 |
| __audit_syscall_entry | 0.305726 | 1547000000 |
| __virt_addr_valid | 0.320762 | 2184000000 |
| check_stack_object | 0.165393 | 1339000000 |
| udp_recvmsg | 1.12267 | 1027000000 |
| func@0x4dfdc0 | 0.390929 | 2691000000 |
| copy_user_enhanced_fast_string | 1.62887 | 2964000000 |
| __check_object_size | 0.375893 | 3172000000 |
| func@0x8e4b20 | 0.65656 | 4355000000 |
| func@0x8e4550 | 0.350833 | 1911000000 |
| func@0x639aa7 | 0.205488 | 1573000000 |
| func@0x639300 | 0.536274 | 1794000000 |
Functions whose symbols were not found and I presume they are probably either some library code or your application code (with symbols stripped). These functions should be investigated more in-depth.
I'm interested in those functions call chains and especially any kernel mode callees of aforementioned functions. Here the call stacks are very important to inspect, beside that an custom analysis is needed to further investigate the aforementioned functions performance.
If it is possible you may share with me either tb7 or system-wide.perf result file.
- Mark as New
- Bookmark
- Subscribe
- Mute
- Subscribe to RSS Feed
- Permalink
- Report Inappropriate Content
I do not know how this issue is relevant to your current HW and SW setup, but it is worth investigating.
On RHEL6 server, audit_filter_syscall causing high CPU utilization
Here is the source code of aforementioned function. Pay attention to locking and unlocking calls, maybe there is a deadlock scenario in your case?
https://elixir.bootlin.com/linux/latest/source/kernel/auditsc.c#L809
- Mark as New
- Bookmark
- Subscribe
- Mute
- Subscribe to RSS Feed
- Permalink
- Report Inappropriate Content
Thanks Bernard,
We tried to disable the audit, But we still see the same behaviour, the CPU usage is high for 1st and hour or two and then it reduces.
Regards,
Soumit
- Mark as New
- Bookmark
- Subscribe
- Mute
- Subscribe to RSS Feed
- Permalink
- Report Inappropriate Content
We tried to disable the audit, But we still see the same behaviour, the CPU usage is high for 1st and hour or two and then it reduces.
Have you seen a high execution time of audit_filter_syscall function after disabling an audit?
- Subscribe to RSS Feed
- Mark Topic as New
- Mark Topic as Read
- Float this Topic for Current User
- Bookmark
- Subscribe
- Printer Friendly Page