- Mark as New
- Bookmark
- Subscribe
- Mute
- Subscribe to RSS Feed
- Permalink
- Report Inappropriate Content
I am using Intel PCM api described on www.intel.com/software/pcm ; to query L3 cache hits/misses of a test program.
The test code creates two threads, reader and writer. Reader and Writer threads are bound to a cpu core in such a way that they run on different NUMA nodes.
The writer thread does the following
PCM * m = PCM::getInstance();
if (m->program() != PCM::Success)
{
std::cout <<"PCM error: " <<m->program() <<"\n";
return;
}
SystemCounterState before_sstate = getSystemCounterState();
int run_count = 0;
while (running_status && (run_count < MAX_RUN_COUNT))
{
run_count++;
if (__sync_bool_compare_and_swap(&obj_lock_cacheline->fd_lock, 0, 1))
{
dummy_workload_writer(obj_data_cacheline->data, sizeof(obj_data_cacheline->data));
__sync_bool_compare_and_swap(&obj_lock_cacheline->fd_lock, 1, 0);
}
}
SystemCounterState after_sstate = getSystemCounterState();
std::cout << "Instructions per clock: " << getIPC(before_sstate,after_sstate)
<<"\nL2 cache hit ratio: " <<getL2CacheHitRatio(before_sstate, after_sstate)
<<"\nL2 cache misses: " <<getL2CacheMisses(before_sstate, after_sstate)
<<"\nL2 cache hits: " <<getL2CacheHits(before_sstate, after_sstate)
<< "\nL3 cache hit ratio:" << getL3CacheHitRatio(before_sstate,after_sstate)
<< "\nL3 cache misses:" << getL3CacheMisses(before_sstate,after_sstate)
<< "\nL3 cache hits:" << getL3CacheHits(before_sstate,after_sstate)
<< "\nBytes read:" << getBytesReadFromMC(before_sstate,after_sstate)
<<"\n";
dummy_workload_writer() does the following
void dummy_workload_writer(char* data, int len)
{
for (int i = 0; i < 1; i++)
data = data + 1;
}
I am unable to make sense of the counters that are printed after writer thread finishes. For example, the L3 Hits & Misses counters. I would expect their value to reduce when I reduce the value of MAX_RUN_COUNT and further reduce when I make sure that lock can never be acquired. Here are some samples:
[run-count = 100, no reader thread] - L3 cache misses:43358, L3 cache hits:153243
[run-count = 1, no reader thread] - L3 cache misses:42940, L3 cache hits:155889
[run-count = 1, no reader thread, lock cannot be acquired] - L3 cache misses:43785, L3 cache hits:172705
I am unable to understand what is causing so many L3 cache hits + misses when the peice of code under measurement is accessing just a couple of cache-lines in the 3rd case?
Please note that the operating system is RHEL Real Time version on an Intel XEON series processer. The cores on which I run this process are isolated using Tuna.
Link Copied
- Mark as New
- Bookmark
- Subscribe
- Mute
- Subscribe to RSS Feed
- Permalink
- Report Inappropriate Content
L3 cache is global and shared by all cores and counters are not tracking the specific thread's IP so you are probably getting the events not related to your test program.Try to run the same test case under VTune.
- Mark as New
- Bookmark
- Subscribe
- Mute
- Subscribe to RSS Feed
- Permalink
- Report Inappropriate Content
Ok, in that case we can look at the L2 cache counters. Here L2 cache hits/misses counter is relatively constant for the first two cases, when the amount of work/instructions is reduced. Going from 2nd to 3rd case, wherein the work/instructions is further reduced, they increase.
[run-count = 100, no reader thread] - L2 cache misses: 196601, L2 cache hits: 45954
[run-count = 1, no reader thread] - L2 cache misses: 198829, L2 cache hits: 45478
[run-count = 1, no reader thread, locked always] - L2 cache misses: 216490, L2 cache hits: 49582
Meanwhile, I will run this test program under VTune and get the results.
- Mark as New
- Bookmark
- Subscribe
- Mute
- Subscribe to RSS Feed
- Permalink
- Report Inappropriate Content
I see that you are using RT version of Linux , but can you set affinity or pin your threads to specific logical CPU.L2 cache is shared between the logical processors and counters can be counting hits and misses of non related process's threads.
- Mark as New
- Bookmark
- Subscribe
- Mute
- Subscribe to RSS Feed
- Permalink
- Report Inappropriate Content
Thank you for the quick reply. I had ran my test by isolating the CPU core and its logical sibling. Just to be sure, I re-ran these tests again, making sure both the logical processors are isolated.
Here is the NUMA topology of my machine:
NUMA node0 CPU(s): 0-7,32-39
NUMA node1 CPU(s): 8-15,40-47
NUMA node2 CPU(s): 16-23,48-55
NUMA node3 CPU(s): 24-31,56-63
In order to isolate the CPUs, I ran the following cmd:
tuna -c 8,40,16,48 -i
I have also attached the output of 'tuna -P' to show the affinity of all the processes running on this system. There are some kernel processes, irqs with affinity set to ALL cpus. Apart from them, no other process should be allowed to run on the isolated CPUs.
I got the following test results:
[run-count = 100, no reader thread] - L2 cache misses: 173573, L2 cache hits: 41413
[run-count = 1, no reader thread] - L2 cache misses: 194613, L2 cache hits: 45525
[run-count = 1, no reader thread, locked always] - L2 cache misses: 194930, L2 cache hits: 45050
Is it possible that the high number of L2 cache counters I am observing is due to the kernel threads with affinity to run on ALL CPUs ?
In that case, is it possible to get counters specific for a thread using PCM? Or will I need to use VTune for it?
- Mark as New
- Bookmark
- Subscribe
- Mute
- Subscribe to RSS Feed
- Permalink
- Report Inappropriate Content
As a counters are not restricted to specific Instruction Pointer so then they will be incremented on any code scheduled to run on specific core.It seems that some kernel code is evenly scattered and scheduled to run on any core so it will contribute to hit/miss count.The interesting question will be memory related operations of kernel code and how does it influence counter count.
- Mark as New
- Bookmark
- Subscribe
- Mute
- Subscribe to RSS Feed
- Permalink
- Report Inappropriate Content
I noticed that the "dummy_workload_writer()" function does not use the "len" argument -- the loop length is fixed at 1 iteration.
I can't tell from looking at the code how many times it actually executes. Do you print out the values of data to find out how many times it has been incremented?
There are variants of some of the counters that count locked accesses that might be helpful in differentiating types of accesses. Details depend on the model. Since you are running a four-socket system with 8 cores per socket, I will guess that you are using a Xeon E5-46xx.
For this processor, relevant counter events are found in section 19.4 of Volume 3 of the Intel Software Developer's Guide (document 325384 -- I am using revision 047):
L2_STORE_LOCK_RQSTS.MISS (Event 27h, Umask 01h)
L2_STORE_LOCK_RQSTS.HIT_E (Event 27h, Umask 04h)
L2_STORE_LOCK_RQSTS.HIT_M (Event 27h, Umask 08h)
L2_STORE_LOCK_RQSTS.ALL (Event 27h, Umask 0Fh)
LOCK_CYCLES.SPLIT_LOCK_UC_LOCK_DURATION (Event 63h, Umask 01h)
LOCK_CYCLES.CACHE_LOCK_DURATION (Event 63h, Umask 02h)
MEM_UOP_RETIRED.LOCK_LOADS (Event D0h, Umask 21h)
MEM_UOP_RETIRED.LOCK_STORES (Event D0h, Umask 22h)
SQ_MISC.SPLIT_LOCK (Event F4h, Umask 10h)
I don't know what a "split lock" is, but I would probably look at all of these numbers just to see if anything stands out, and would compare it to the values in data that (if I understand the code correctly) tell how many times the "dummy_workload_writer()" function is called.
The performance counters can also be set up to count in either user space or kernel space or both. (I don't know how to make this request via PCM, but it ought to be there?). If there is a concern that your counts are being contaminated by kernel activities, you might want to compare the values with and without kernel mode counting enabled.
Finally, you should be aware that the core's L3 counters don't count accesses (hit or miss) due to hardware prefetch activity. If the "dummy_workload_writer()" function is actually set up to use a length of more than a few elements, the hardware prefetchers may be responsible for most of the L3 accesses, leaving the L3 counters to show just the few misses that show up at the beginning of the loop before the prefetchers get started. The L2 counters have more options, but I don't know what specific events PCM is using in your tests.
None of my experiments with the hardware counters have considered the behavior for locked accesses. I should add these to my microbenchmark suite.
- Mark as New
- Bookmark
- Subscribe
- Mute
- Subscribe to RSS Feed
- Permalink
- Report Inappropriate Content
It would be interesting to see a results when you will use Len variable in dummy_workload_writer function.
- Mark as New
- Bookmark
- Subscribe
- Mute
- Subscribe to RSS Feed
- Permalink
- Report Inappropriate Content
I was trying to reduce the workload performed in each iteration to see how it affects the PMU counters. Thats why I must have changed the loop to end at 1 instead of len in dummy_workload_writer().
While making this change to use len, I realized that I had made a very silly mistake of not initializing the lock variable with 0.
As John inferred, I am running these tests on Intel(R) Xeon(R) CPU E5-4650 @ 2.70GHz
I will read the Intel Software Developer's Guide, and the portions pointed out by John, and figure out how to proceed further.
I will figure out if PCM allows counting only in user-space. Meanwhile, I re-ran the tests with the above mentioned fixes. I have also printed the value of data[0] once the test finishes
[run-count = 100, no reader thread] - L2 cache misses: 210763, L2 cache hits: 48633, data[0] = 100
[run-count = 1, no reader thread] - L2 cache misses: 175232, L2 cache hits: 41098, data[0] = 1
[run-count = 1, no reader thread, locked always] - L2 cache misses: 229151, L2 cache hits: 53412, data[0] = 0
- Mark as New
- Bookmark
- Subscribe
- Mute
- Subscribe to RSS Feed
- Permalink
- Report Inappropriate Content
As John hinted hardware prefetchers could be helpful in reducing L3 misses mainly because a predictable nature of data array index.How large is data[] array?Can you set the for loop upper bound to Len and rerun your test?
- Mark as New
- Bookmark
- Subscribe
- Mute
- Subscribe to RSS Feed
- Permalink
- Report Inappropriate Content
data[] is 64 bytes in size.
The test results that I posted last were taken aftetrsetting upper bound of loop to len in dummy_workload_writer()
- Mark as New
- Bookmark
- Subscribe
- Mute
- Subscribe to RSS Feed
- Permalink
- Report Inappropriate Content
I think that testing your application with VTune should be also considered.At least to know the contribution of kernel mode code generated hits and misses .
- Mark as New
- Bookmark
- Subscribe
- Mute
- Subscribe to RSS Feed
- Permalink
- Report Inappropriate Content
Hi,
I re-ran the test and captured data using VTune. I was unable to capture any events of interest with the run-count used earlier, therefore, I increased the run-count to 100K.
I considered three scenarios:
1) Lock variable's initial value is zero. Reader & Writer thread both check lock value before calling sync_bool_compare_and_swap()
2) Lock variable's initial value is 1. Reader & Writer thread both check lock value before calling sync_bool_compare_and_swap()
3) Lock variable's initial value is 1. Reader & Writer thread DO NOT check lock value before calling sync_bool_compare_and_swap()
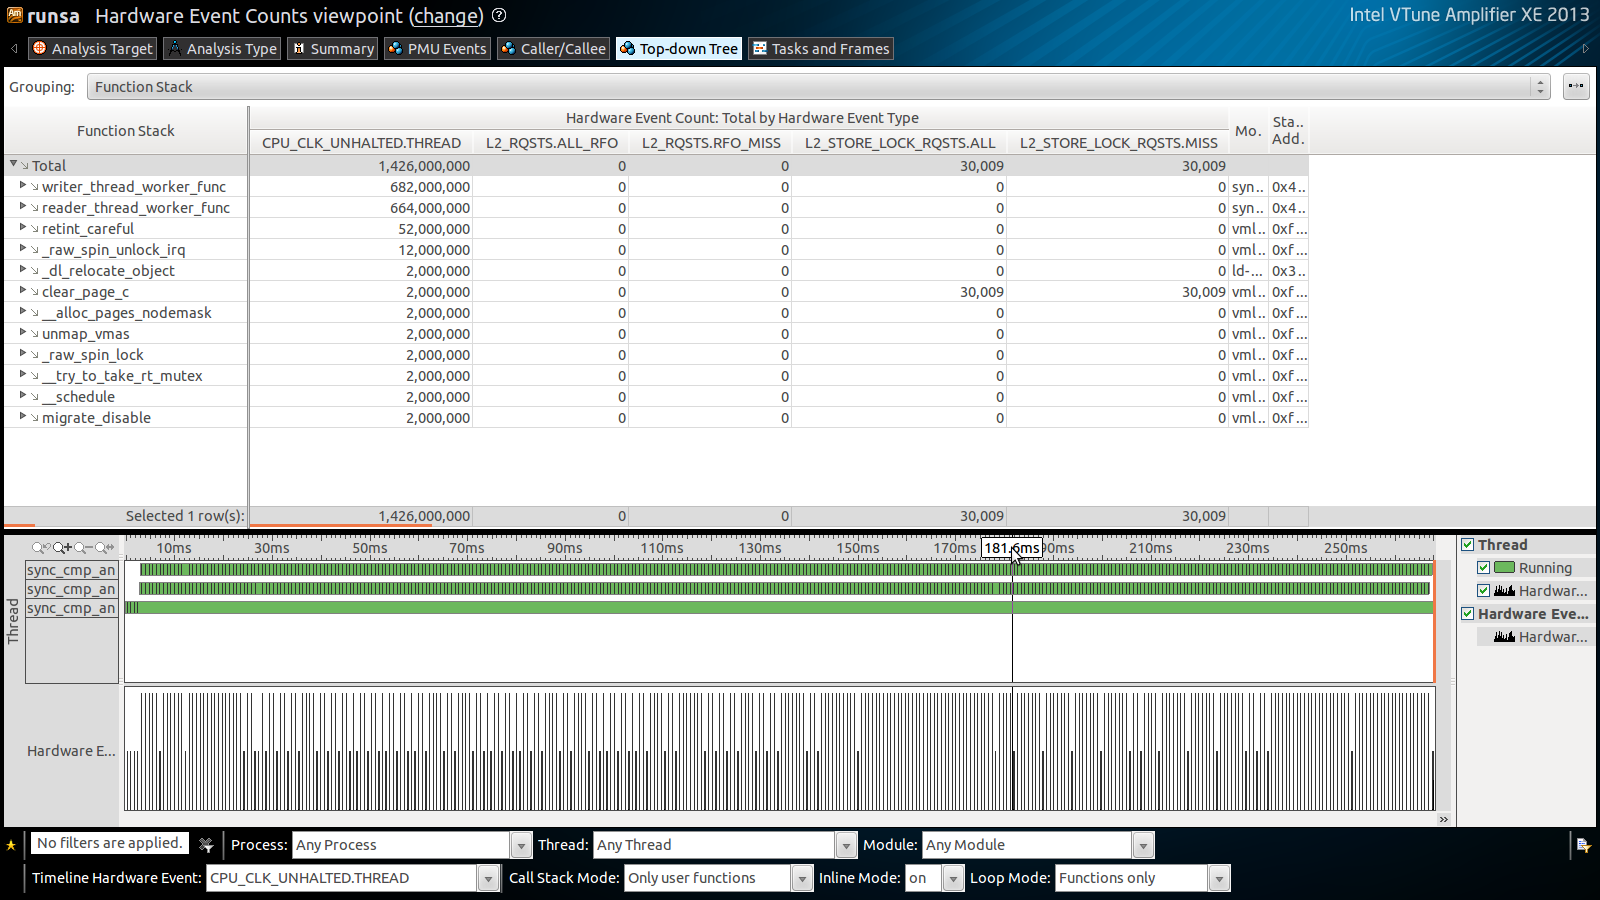
I have attached output of VTune GUI displaying the captured data for each of the scenario.
The results are along the expected lines, and different from what I was seeing using PCM API. Looks like the kernel threads running were also contributing to the measured events.
Using VTune I could see that after transitioning from Scenario 1 to Scenario 2, the number of RFO's reduce to zero since both the threads think that lock is already taken and therefore, do not call sync_bool_compare_and_swap().
Also, while transitioning from Scenario 2 to Scenario 3, the number of RFO's increase, even though both the threads can never acquire the lock, because they blindly call sync_bool_compare_and_swap() instead of first checking the value of lock variable, thus causing cache-line ping-pong among CPUs.
Thank you for your help and support in analysing these results.
- Mark as New
- Bookmark
- Subscribe
- Mute
- Subscribe to RSS Feed
- Permalink
- Report Inappropriate Content
I have a few follow-up questions.
1) In the result generated for scenario 1, I see ZERO value for L2_RQSTS.ALL_RFO counter for the function dummy_workload_writer() even though it writes on a different cache-line that the one used by the lock variable, and the reader thread reads that value.
2) How does VTune correlate Hardware Event counters with functions/instructions? Between two samples taken by VTune, if an event counter increments, then it could be due to any previous instructions that executed after the first sample was taken? Sorry, if this question is naive. If you can point me to any document that I can read-up to figure out the answer, that would be really helpful.
3) To confirm something that might be obvious, Does L2_RQSTS.ALL_RFO not include events counted by L2_RQSTS.RFO_MISS? Similarly for L2_STORE_LOCK_RQSTS.ALL and L2_STORE_LOCK_RQSTS.MISS?
4) Also does L2_RQSTS.ALL_RFO not include L2_STORE_LOCK_RQSTS.ALL? I am unable to figure this out based on the description given in section 19.4 of Volume 3 of the Intel Software Developer's Guide.
- Mark as New
- Bookmark
- Subscribe
- Mute
- Subscribe to RSS Feed
- Permalink
- Report Inappropriate Content
2) Vtune driver will call clock interrupt routine probably once per millisecond to collect sampling data.Various counters do not track specific executing thread virtual address so they will be incremented on every occurrence of the event generated by running code which belongs to various threads.So in this case VTune must resolve instruction pointer of the running thread and probably compare it to the module pdb file in order to map addresses to function names.
- Subscribe to RSS Feed
- Mark Topic as New
- Mark Topic as Read
- Float this Topic for Current User
- Bookmark
- Subscribe
- Printer Friendly Page