- Mark as New
- Bookmark
- Subscribe
- Mute
- Subscribe to RSS Feed
- Permalink
- Report Inappropriate Content
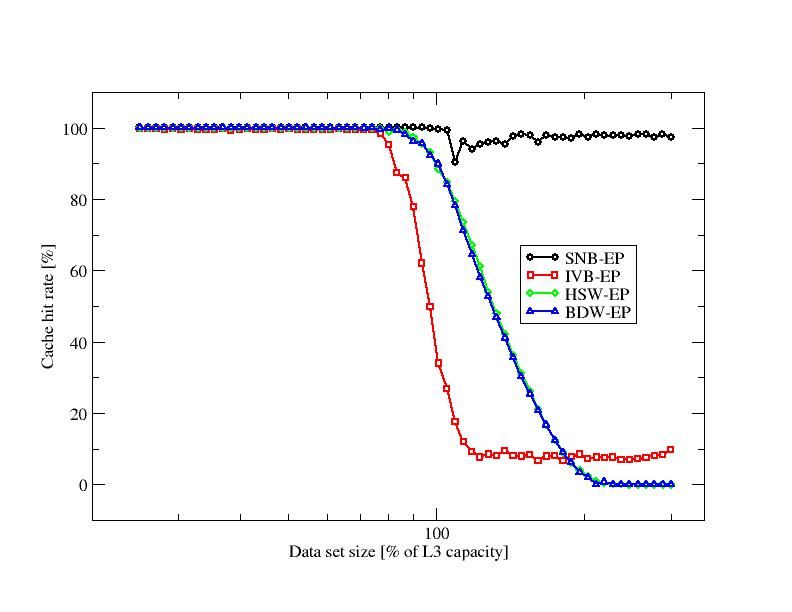
I'm trying to measure L3 hit rates on SNB, IVB, HSW, and BDW using the MEM_LOAD_UOPS_RETIRED.L3_HIT and MEM_LOAD_UOPS_RETIRED.L3_MISS counters. For HSW and BDW this works really good, for SNB and IVB not so much. See the plot below (note that all hardware prefetchers were disabled during the measurements). The documentations says these counters may undercount. I found that they are a factor of 3000 lower on SNB and IVB than on HSW and BDW. Also, the ratio does not appear to reflect the real hit and miss ratios.
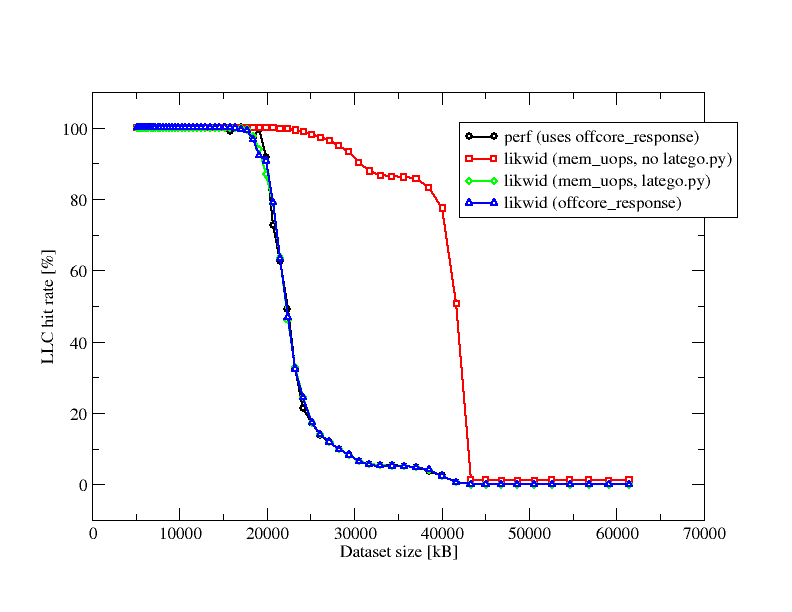
Interestingly I found that using perf stat -e LLC-loads,LLC-load-misses works. The counters do not undercount and the hit rate is also computed correctly. However I did not manage to extract which events perf uses. The code is just to... complex. Can someone tell me which counters are recommended to measure the L3 hit rate?
Link Copied
- Mark as New
- Bookmark
- Subscribe
- Mute
- Subscribe to RSS Feed
- Permalink
- Report Inappropriate Content
When I want to figure out what "perf" is programming, I just start a job under "perf stat" that is stalled on stdin (and pinned to a specific target core), then use a different terminal window to read the performance counter MSRs for the target core. The perf subsystem will disable the counters on the target when the kernel executes the cross-core MSR read, but in the kernels I have tested it only clears the "enable" bit and leaves the Event and Umask fields unchanged.
For Sandy Bridge, you have to be careful not to generate 256-bit AVX loads, since these will never increment the MEM_LOAD_UOPS_RETIRED.L3_HIT event (or the corresponding L2_HIT event).
Also for Sandy Bridge EP, Intel refers to some workarounds in the announcement at https://software.intel.com/en-us/articles/performance-monitoring-on-intel-xeon-processor-e5-family and in the corresponding processor specification update. These are not described clearly anywhere, but they are implemented in the simple code at https://github.com/andikleen/pmu-tools/blob/master/latego.py, so even if it is not clear what the workarounds are doing, at least it is clear what bits need to be flipped.
When I tried these workarounds on the Xeon E5-2680 (v1) with the HW prefetchers disabled, they fixed the near-100% undercounting that I had seen without the workarounds and gave numbers that were in the right ballpark and that showed much better agreement with the OFFCORE_REQUESTS counts. Unfortunately the OFFCORE_REQUESTS counts that were usable in Sandy Bridge with HW prefetch disabled don't appear to be correct on Haswell even with HW prefetch disabled, so I did not follow up on these studies.
For Ivy Bridge client parts there is an interesting discussion of the cache replacement policy at http://blog.stuffedcow.net/2013/01/ivb-cache-replacement/ -- I have not looked at this on any server parts....
- Mark as New
- Bookmark
- Subscribe
- Mute
- Subscribe to RSS Feed
- Permalink
- Report Inappropriate Content
Hi John,
thanks for the input. Indeed I was using AVX loads. Using SSE loads and the latego.py script fixes the issue. I now get the same results using perf (which by the way uses offcore_response counters) likwid with mem_uops, and likwid with offcore_response.
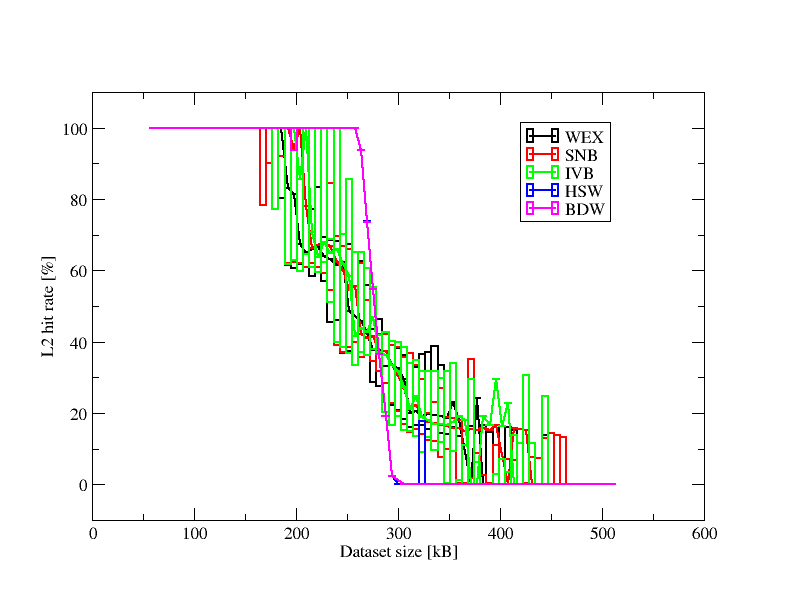
Do you by any chance have made some measurements pertaining to L2 hitrates? I see really erratic hitrates pre-HSW; also, the hitrates are too good to be true for a LRU cache. I see hitrates over 20% for dataset sizes larger than 400kB. All documented prefetchers are off. My best guess is either the counters are buggy (I'm using L1D_REPLACEMENT and MEM_LOAD_UOPS_RETIRED_L2_HIT and it's a load-only benchmark) or there's an undocumented prefetcher or (victim?) cache at work. Boxplot without whiskers to make data more readable; boxes are 25- and 75- percentiles.
- Mark as New
- Bookmark
- Subscribe
- Mute
- Subscribe to RSS Feed
- Permalink
- Report Inappropriate Content
The L1D.REPLACEMENT event looks good on Sandy Bridge.
There is one extra prefetcher without a documented "off" switch -- the "next page prefetcher". This is present in IVB and Haswell processors (and newer, presumably). I have not looked at how much it fetches, but I would not be surprised if it fetched only one line -- the main benefit seems to be that it fetches a line from the next page early enough to get the next page's TLB entry loaded before the first demand load to that next page.
The behavior in the bottom figure certainly looks strange. Is this variability seen within runs or across runs or both? Did you check to make sure you are running on large pages on all the systems?
I have not used the MEM_LOAD_UOPS_RETIRED counters very much because they are broken on so many systems.... For L2 hit rate I have had good luck with L1D.REPLACEMENT and L1D.EVICTION, and some luck with L2_RQSTS (Event 0x24), L2_L1D_WB_RQSTS (Event 0x27), and L2_TRANS (Event 0xF0) (this last one counts retries, which are sometimes important in getting the counts to make sense). To look for L2 misses, I find that the counters in the L3 caches are more reliable than the L2 events (e.g., OFFCORE_REQUESTS (Event 0xB0).
I have not done much testing on IVB (we only have one IVB cluster, and it is not very big), but going from SNB to HSW I found a number of events that were broken on SNB are fixed on HSW. Unfortunately about the same number of events that work fine on SNB are broken in HSW (especially OFFCORE_RESPONSE counts and QPI TxL_FLITS_G* and RxL_FLITS_G*). The OFFCORE_RESPONSE counters look good for some events on SNB, but the tables include several transaction types that make no sense (e.g., WriteBacks, which don't have a "response"), and these were removed on HSW. Other OFFCORE_RESPONSE events were also removed in HSW, and (if I recall correctly) the remaining events were not enough to fill the gaps in the traffic accounting that I was trying to do.
Most of my work lately has been on KNL -- some good news and some bad news, but with an overall pattern that is almost (but not quite) entirely unlike what I see on the various Xeon E5 processor generations.
I should get access to some BDW systems this week, and will have a look at some of these events (and the FP arithmetic instruction counting events).
- Subscribe to RSS Feed
- Mark Topic as New
- Mark Topic as Read
- Float this Topic for Current User
- Bookmark
- Subscribe
- Printer Friendly Page


