- Mark as New
- Bookmark
- Subscribe
- Mute
- Subscribe to RSS Feed
- Permalink
- Report Inappropriate Content
Hi,
my software is very sensitive to low latency and i'm trying to find what cause the latency and how to resolve it.
this is pseudo code of my software
timer_func() {
do some calc
register new timer
}
main(){
while(1){
check if timer ready ?
if ready - timer_func
}
}
i'm measuring the time it takes the timer function to run. i'm doing 10000 iterations.
i found that some that almost all the time it takes less then 200 nano to run the timer code but some times around 10 times it takes 6.5 micro second !!!?
i used libpfm to measure cpu events and found out that when it takes 6.5 micro second i'm seeing RAT_STALLS:FLAGS
How can i solve this issue ?
Link Copied
- « Previous
-
- 1
- 2
- Next »
- Mark as New
- Bookmark
- Subscribe
- Mute
- Subscribe to RSS Feed
- Permalink
- Report Inappropriate Content
these are the events i'm going to collect
CPU_CLK_UNHALTED
INT_MISC:RAT_STALL_CYCLES:c=1
HW_INTERRUPTS
PERF_COUNT_SW_CONTEXT_SWITCHES
taken from libpfm running on Sandybridge:
any other events needed ?
i'll post the results later today
- Mark as New
- Bookmark
- Subscribe
- Mute
- Subscribe to RSS Feed
- Permalink
- Report Inappropriate Content
You can use VTune to collect Context Switches by enabling Advanced Hotspot Analysis.
- Mark as New
- Bookmark
- Subscribe
- Mute
- Subscribe to RSS Feed
- Permalink
- Report Inappropriate Content
amir k. wrote:
It is interesting what really happens at machine code level around ~100 nano seconds. There is big spike of RAT_STALLS event(s) , but there is no way how to map those events to executed assembly code.
@amir
Can you tell me how this screenshot correlates to executed code? I mean time frame with 1e+3 nano sec step resolution corresponds to main() function or to the prologue of your timer function?
- Mark as New
- Bookmark
- Subscribe
- Mute
- Subscribe to RSS Feed
- Permalink
- Report Inappropriate Content
@amir
In my previous post I quoted your response #21 , but screenshot was not posted.
- Mark as New
- Bookmark
- Subscribe
- Mute
- Subscribe to RSS Feed
- Permalink
- Report Inappropriate Content
I'll post vtune screen shuts later today.
- Mark as New
- Bookmark
- Subscribe
- Mute
- Subscribe to RSS Feed
- Permalink
- Report Inappropriate Content
i see some interrupts during the run
eth0-TxRx-N - on all each cores
NMI - on some cores
LOC - on all cores
i'll try to disable the interrupts and run the test again.
- Mark as New
- Bookmark
- Subscribe
- Mute
- Subscribe to RSS Feed
- Permalink
- Report Inappropriate Content
>>>eth0-TxRx-N - on all each cores>>>
Do you have heavy network traffic when you are testing your code?
- Mark as New
- Bookmark
- Subscribe
- Mute
- Subscribe to RSS Feed
- Permalink
- Report Inappropriate Content
no i don't have heavy network traffic.
- Mark as New
- Bookmark
- Subscribe
- Mute
- Subscribe to RSS Feed
- Permalink
- Report Inappropriate Content
i set the affinity of all interrupt to core0 except for NMI and LOC and the application is running on all the other cores except for core0.
i still get slow iterations
- Mark as New
- Bookmark
- Subscribe
- Mute
- Subscribe to RSS Feed
- Permalink
- Report Inappropriate Content
1. I am not quite sure what this means:
if i call the timer function more frequent less then 1 millisecond i don't see slow iteration but if it's slower then 1 millisecond i see the problem.
Does this mean that if you decrease the number of iterations so that the total test takes less than 1 millisecond, you get no slow iterations? If this is what you mean then it seems extremely likely that the slow iterations are due to the local timer interrupt. You might be able to build a kernel with a 100 Hz (10 millisecond) local timer interrupt, but the local timer interrupts will always be there -- they are fundamental to the way Linux does task management and scheduling.
2. Is the number of slow iterations approximately equal to the total execution time in milliseconds? This would be another easy "hint" that the slow iterations are due to local timer interrupts.
3. Did you compute the interval between slow iterations? Even if you are not storing all the timer values, it should only take a few extra cycles to check to see if the iteration is "slow" and save the absolute start and/or end times for those iterations.
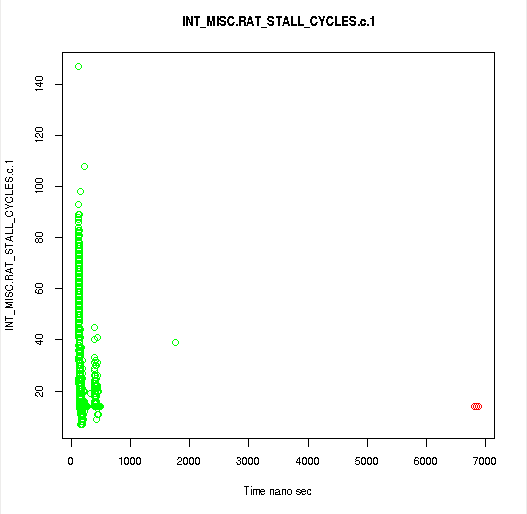
4. The posted figure shows that "RAT_STALL" cycles dominate in the "normal" iterations, and are quite small in the long duration iterations. So this counter is not helpful if you are trying to understand the cause of the long iterations.
5. The source of the RAT_STALL cycles in the "normal" iterations depends on what you are using for a timer. What are you using for a timer? An inline RDTSC or RDTSCP instruction should be much faster than the 200 ns you are seeing -- they take about 30-40 core cycles on most platforms (10-15 ns).
- Mark as New
- Bookmark
- Subscribe
- Mute
- Subscribe to RSS Feed
- Permalink
- Report Inappropriate Content
1) "Does this mean that if you decrease the number of iterations so that the total test takes less than 1 millisecond, you get no slow iterations?" - yes no sloe iteration.
2) "Is the number of slow iterations approximately equal to the total execution time in milliseconds?" - no
3) "Did you compute the interval between slow iterations?" - i'll do it.
5) "What are you using for a timer?" - i'm not sure what you mean with this question so i'm going to answer on two things 1) to measure time i'm using rdtsc 2) my timer code uses stl vector to store all pending timers and called rdtsc to find out if it should run the timer.
- Mark as New
- Bookmark
- Subscribe
- Mute
- Subscribe to RSS Feed
- Permalink
- Report Inappropriate Content
one more finding from today.
when i set the irq_affinity of all the irq's to core0 (i don't run my test on core0) there where fewer slow iterations.
i added tables with how many slow iterations on all cores please disregard the package it always set to 1. affinity 1 - 7 package 1 and affinity 8-15 package 2
before setting eth0 irq affinity

after setting eth0 irq affinity

- Mark as New
- Bookmark
- Subscribe
- Mute
- Subscribe to RSS Feed
- Permalink
- Report Inappropriate Content
>>>when i set the irq_affinity of all the irq's to core0 (i don't run my test on core0) there where fewer slow iterations.>>>
So probably timer interrupts are causing slow down of your code and not RAT_STALL events.
- Mark as New
- Bookmark
- Subscribe
- Mute
- Subscribe to RSS Feed
- Permalink
- Report Inappropriate Content
i'll compile kernel with 100 Hz (10 millisecond) local timer interrupt and run the test again.
thanks everyone.
i'll post the results in few days.
- Mark as New
- Bookmark
- Subscribe
- Mute
- Subscribe to RSS Feed
- Permalink
- Report Inappropriate Content
You are welcome.
- Subscribe to RSS Feed
- Mark Topic as New
- Mark Topic as Read
- Float this Topic for Current User
- Bookmark
- Subscribe
- Printer Friendly Page
- « Previous
-
- 1
- 2
- Next »