- Mark as New
- Bookmark
- Subscribe
- Mute
- Subscribe to RSS Feed
- Permalink
- Report Inappropriate Content
Running VTune Profiler 2022.1.0 - Product build: 621966
Installed on Windows 11 w/Visual Studio 2022 17.1.0 using suggested workaround:
Re:VTune Installation Fails - Windows 11 - Visual Studio 2022 (17.1.0)
Hi Elliot, our investigation has shown us that on Microsoft* Windows*, the installation of Intel® oneAPI Toolkits versions 2022.1 and 2022.1.2 and standalone components will fail using Microsoft* Visual Studio* 2022 version 17.1.x.
There are 2 possible workarounds, prior to installing an Intel® oneAPI toolkit or component:
Uninstall Visual Studio 2022 version 17.1.x and install the older version 17.0.6 from here Visual Studio 2022 Release History | Microsoft Docs> https://docs.microsoft.com/en-
We are striving to provide a new release in the weeks ahead to address this installation issue. Please let me know if you have any questions on this.
Attempting to run Hotspot analysis on Intel matrix sample using hardware event-based sampling but always results in BSOD.
I have attached the Windbg output using !analyze -v on the memory.dmp file.
I am running an Alder Lake i5-12600K on an ASUSTek TUF GAMING Z690-PLUS WIFI D4 w/latest BIOS and latest Windows 11 updates.
Link Copied
- Mark as New
- Bookmark
- Subscribe
- Mute
- Subscribe to RSS Feed
- Permalink
- Report Inappropriate Content
Hi,
Thank you for posting in Intel Communities.
Could you please confirm whether you’ve tried the suggested workaround – using Microsoft Visual studio 17.0.6? Is it still giving the BSOD issue?
If you want to use Vtune profiler without visual studio, please use Vtune profiler as a standalone. To download the standalone version: https://www.intel.com/content/www/us/en/developer/tools/oneapi/vtune-profiler-download.html .
Also please refer Hotspots Analysis for CPU Usage Issues to learn about on how to configure Hotspot analysis using hardware event-based sampling in Vtune Profiler.
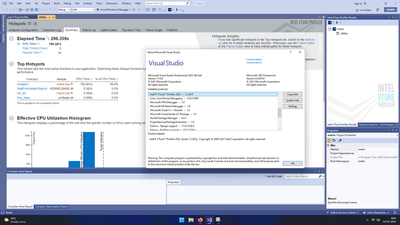
We were unable to reproduce the issue when we tried it from our end. Please refer the screenshot.
OneAPI toolkit version: 2022.1.2
Microsoft visual studio version: 17.0.6
Operating system: Windows 11.
Please reach out if you are facing issues after trying the suggested workaround along with commands to reproduce/steps and self checker logs.
Regards
Gopika
- Mark as New
- Bookmark
- Subscribe
- Mute
- Subscribe to RSS Feed
- Permalink
- Report Inappropriate Content
Hello!
I am using Visual Studio Community 2022 v17.1.0. I was able to install the standalone VTune 2022.1 by replacing the
amplxe-sepreg.exe -c
amplxe-sepreg.exe -i
This was per instructions on this page: Install the Sampling Drivers for Windows Targets (intel.com)
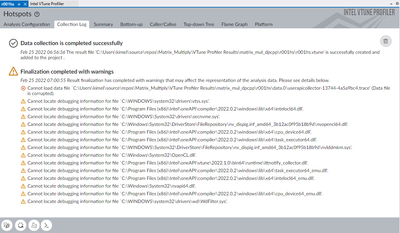
Following your reply, I attempted to run Hotspot analysis from within Visual Studio Community 2022 v17.1.0. I did not experience a BSOD and the data collection completed successfully. However, I did get the following warnings:
I ran the Hotspot analysis a second time from within Visual Studio and got similar warnings. In particular, it seems that a data file was always corrupted:
Cannot load data file `C:\Users\kimel\source\repos\Matrix_Multiply\VTune Profiler Results\matrix_mul_dpcpp\r001hs\data.0\userapicollector-13744-4a5a9bc4.trace' (Data file is corrupted).
Going back to the standalone VTune component...
Interestingly, when I unloaded Samsung Magician from the Windows 11 System Tray I was able to perform Hotspot analysis in the standalone VTune component w/o experiencing a BSOD. Is it possible that some third party applications (e.g. Samsung Magician) could interfere with VTune?
- Mark as New
- Bookmark
- Subscribe
- Mute
- Subscribe to RSS Feed
- Permalink
- Report Inappropriate Content
Hi,
Warning: “Cannot locate debugging information for file”
Solution:
Debugging information (PDB files on Windows* and DWARF format on Linux*) for applications and system modules is not generally available on the system by default. Missing debug information is not critical to performance analysis but prevents Intel® VTune™ Profiler from providing full-scale statistics on call stacks, source data, and so on.
If the VTune Profiler does not find debug information for the binaries, it statically identifies function boundaries and assigns hotspot addresses to generated pseudo names func@address for such functions, for example:
If a module is not found or the name of a function cannot be resolved, the VTune Profiler displays module identifiers within square brackets, for example: [module].
If the debug information is absent, the VTune Profiler may not unwind the call stack and display it correctly in the Call Stack pane. Additionally in some cases, it can take significantly more time to finalize the results for modules that do not have debug information.
See detailed instructions to enable debug information
Question: Cannot load data file and third-party applications interfering with VTune
Answer:
To analyze these issues from our end, could you please share with us the self-checker output? To know more about self-checker, please refer: https://software.intel.com/content/www/us/en/develop/documentation/vtune-help/top/installation/verify-linux-installation.html.
Also, could you please confirm whether you are running the Vtune Profiler as an administrator.
Regards
Gopika
- Mark as New
- Bookmark
- Subscribe
- Mute
- Subscribe to RSS Feed
- Permalink
- Report Inappropriate Content
Hello!
I ran vtune-self-checker.bat in Administrator mode under Windows 11. It ran for a short while (60~75 seconds) but BSOD'ed. I have attached the results of the memory dump in WinDbg using !analyze -v. To answer your earlier question, I always run VTune in administrator mode.
Thank you,
Elliot
- Mark as New
- Bookmark
- Subscribe
- Mute
- Subscribe to RSS Feed
- Permalink
- Report Inappropriate Content
Hello,
I have located the log file from the first crash. The first run crashed while 'running finalization' for the 'Instrumentation based analysis check':
Instrumentation based analysis check
Example of analysis types: Hotspots and Threading with user-mode sampling
Collection: Ok
--------------------------------------------------------------------------------
Running finalization...
I also ran the self-check a second time and it ran to completion w/o BSOD's. There were however two errors at the end of the log file:
The following analyses have failed on the system:
* GPU Compute/Media Hotspots (characterization mode)
* GPU Compute/Media Hotspots (source analysis mode)
I have attached both log files. I have also zipped the contents of the self-checker folder which was created in my Windows temp folder during the first run.
Thank you for your assistance!
Ellioot
- Mark as New
- Bookmark
- Subscribe
- Mute
- Subscribe to RSS Feed
- Permalink
- Report Inappropriate Content
Hi,
We checked your self checker logs, we couldn't find any issue in that. As there is no issues in the logs, please ignore the warnings.
Regards
Gopika
- Mark as New
- Bookmark
- Subscribe
- Mute
- Subscribe to RSS Feed
- Permalink
- Report Inappropriate Content
Hello,
In the attached log named 'log-crash-while-running.txt' my PC BSOD'ed while 'Running finalization':
Instrumentation based analysis check
Example of analysis types: Hotspots and Threading with user-mode sampling
Collection: Ok
--------------------------------------------------------------------------------
Running finalization...
Command line:
C:\Program Files (x86)\Intel\oneAPI\vtune\latest\bin64\vtune.exe -finalize -r C:\Users\kimel\AppData\Local\Temp\vtune-tmp-kimel\self-checker-2022.03.03_00.24.27\result_tpss
I also attached the memory dump analysis. Are you able to inspect it and is there anything you might suggest which is causing the BSOD?
- Mark as New
- Bookmark
- Subscribe
- Mute
- Subscribe to RSS Feed
- Permalink
- Report Inappropriate Content
Hi,
Sorry for the delay in response. The installation issue with OneAPI toolkit 2022.1 and Microsoft visual studio 17.1.x is fixed in the latest version
1. Please try with the latest version of Vtune profiler 2022.2 and Visual Studio version 17.1 and see if the BSOD issue occurs.
2. The issue doesn’t seem to be related to Vtune. Please try in a different or same system and ensure other apps are not running. See if you are encountering BSOD issue again.
Please let us know whether you encounter this issue again even after trying the above steps.
Regards
Gopika
- Mark as New
- Bookmark
- Subscribe
- Mute
- Subscribe to RSS Feed
- Permalink
- Report Inappropriate Content
Hi,
We have not heard from you. Is your query resolved? Can we discontinue monitoring this thread?
Regards
Gopika
- Mark as New
- Bookmark
- Subscribe
- Mute
- Subscribe to RSS Feed
- Permalink
- Report Inappropriate Content
Hi,
We assume that your issue is resolved. If you need any additional information, please post a new question as this thread will no longer be monitored by Intel.
Regards
Gopika
- Subscribe to RSS Feed
- Mark Topic as New
- Mark Topic as Read
- Float this Topic for Current User
- Bookmark
- Subscribe
- Printer Friendly Page

