- Mark as New
- Bookmark
- Subscribe
- Mute
- Subscribe to RSS Feed
- Permalink
- Report Inappropriate Content
I'm trying to run the VTune analyzer on the simplest of simple programs and it looks like I have found a bug in the latest 2022.0.0 release of the tool. Has anyone else seen this error when trying to run OpenCL kernels on the CPU? It only happens in VTune the program runs without issue in MSVC debugger.
1> Native API failed. Native API returns: -6 (CL_OUT_OF_HOST_MEMORY) -6 (CL_OUT_OF_HOST_MEMORY)
I have attached a copy of the MSVC solution for anyone interested.
IDE: MSVC 2019 Version 16.11.7
OS: Windows 11
Processor: Intel i5-1135G7
Driver: 30.0.101.1191
OpenCL: 3.0
Anyone else encounter this?
Link Copied
- Mark as New
- Bookmark
- Subscribe
- Mute
- Subscribe to RSS Feed
- Permalink
- Report Inappropriate Content
Hi,
We are investigating your issue at our end.. We will get back to you soon with an update.
Thanks
Rahul
- Mark as New
- Bookmark
- Subscribe
- Mute
- Subscribe to RSS Feed
- Permalink
- Report Inappropriate Content
Thanks,
Let me know if/when you're able to reproduce the error and if I can provide any additional information!
Drew
- Mark as New
- Bookmark
- Subscribe
- Mute
- Subscribe to RSS Feed
- Permalink
- Report Inappropriate Content
Hi,
We were able to reproduce your issue at our end. We are working on this internally. We will get back to you soon with an update.
Thanks
Rahul
- Mark as New
- Bookmark
- Subscribe
- Mute
- Subscribe to RSS Feed
- Permalink
- Report Inappropriate Content
Hi,
Did you run VTune from standalone version or VS integrated one? Which analysis was run?
- Mark as New
- Bookmark
- Subscribe
- Mute
- Subscribe to RSS Feed
- Permalink
- Report Inappropriate Content
Hi,
We are working on this internally. We will get back to you soon with an update.
Thanks
Rahul
- Mark as New
- Bookmark
- Subscribe
- Mute
- Subscribe to RSS Feed
- Permalink
- Report Inappropriate Content
Hello
Thanks for report as well as for reproducer.
1) Could you clarify oneAPI version do you use?
2) Could you attach self-check report? (self_check.py is located in bin64 directory)
3) Do you use integrated or discrete GPU (if "yes" which one)?
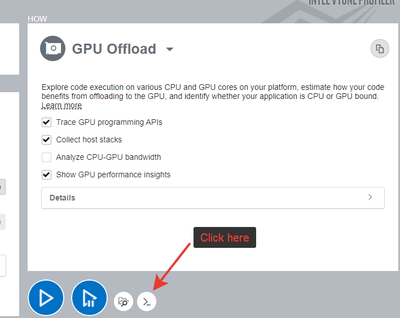
4) Could you add CLI command of your analysis? You could get the row from UI here:
Best regards,
Sergey
- Mark as New
- Bookmark
- Subscribe
- Mute
- Subscribe to RSS Feed
- Permalink
- Report Inappropriate Content
1) OneAPI 2022.0.0
2) See Below
3) Integrated, Intel Xe included with Processor 11th Gen Intel(R) Core(TM) i5-1135G
4) "C:\Program Files (x86)\Intel\oneAPI\vtune\2022.0.0\bin64\vtune" -collect gpu-offload -app-working-dir C:\Users\dahub\source\repos\DPCPPConsoleApplication1\DPCPPConsoleApplication2\ --app-working-dir=C:\Users\dahub\source\repos\DPCPPConsoleApplication1\DPCPPConsoleApplication2\ -- C:\Users\dahub\source\repos\DPCPPConsoleApplication1\x64\Release\DPCPPConsoleApplication2.exe
-------------------------------------------------
Script output starts here
Intel(R) VTune(TM) Profiler Self Check Utility
Copyright (C) 2009-2020 Intel Corporation. All rights reserved.
Build Number: 621730
HW event-based analysis (counting mode) (Intel driver)
Example of analysis types: Performance Snapshot
Collection: Ok
Finalization: Ok...
Report: Ok
Instrumentation based analysis check
Example of analysis types: Hotspots and Threading with user-mode sampling
Collection: Ok
Finalization: Ok...
Report: Ok
HW event-based analysis check (Intel driver)
Example of analysis types: Hotspots with HW event-based sampling, HPC Performance Characterization, etc.
Collection: Ok
Finalization: Ok...
Report: Ok
HW event-based analysis check (Intel driver)
Example of analysis types: Microarchitecture Exploration
Collection: Ok
Finalization: Ok...
Report: Ok
HW event-based analysis with uncore events (Intel driver)
Example of analysis types: Memory Access
Collection: Ok
Finalization: Ok...
Report: Ok
HW event-based analysis with stacks (Intel driver)
Example of analysis types: Hotspots with HW event-based sampling and call stacks
Collection: Ok
Finalization: Ok...
vtune: Warning: The result contains a lot of raw data. Finalization may take a long time to complete.
Report: Ok
HW event-based analysis with context switches (Intel driver)
Example of analysis types: Threading with HW event-based sampling
Collection: Ok
Finalization: Ok...
Report: Ok
Checking DPC++ application as prerequisite for GPU analyses: Fail
Unable to run DPC++ application on GPU connected to this system. If you are using an Intel GPU and want to verify profiling support for DPC++ applications, check these requirements:
* Install Intel(R) GPU driver.
* Install Intel(R) Level Zero GPU runtime.
* Install Intel(R) oneAPI DPC++ Runtime and set the environment.
The system is ready to be used for performance analysis with Intel VTune Profiler.
Review warnings in the output above to find product limitations, if any.
The system is ready for the following analyses:
* Performance Snapshot
* Hotspots and Threading with user-mode sampling
* Hotspots with HW event-based sampling, HPC Performance Characterization, etc.
* Microarchitecture Exploration
* Memory Access
* Hotspots with HW event-based sampling and call stacks
* Threading with HW event-based sampling
The following analyses have failed on the system:
* GPU Compute/Media Hotspots (characterization mode)
* GPU Compute/Media Hotspots (source analysis mode)
- Mark as New
- Bookmark
- Subscribe
- Mute
- Subscribe to RSS Feed
- Permalink
- Report Inappropriate Content
Thanks for the answer
I try to reproduce this scenario on several systems, but it works correctly.
I would be appreciate if you make several experiments:
1) Check behavior with gpu_selector instead of cpu_selector (line 32)
2) Check original application with other analysis type (for example Hotspots or Performance snapshot)
By the way, is there any reason to run GPU analysis when computing task is run on CPU?
Best regards,
Sergey
- Mark as New
- Bookmark
- Subscribe
- Mute
- Subscribe to RSS Feed
- Permalink
- Report Inappropriate Content
1) Works correctly when using the GPU selector.
2) I ran the following command on the original CPU code hoping to run OpenCL on the CPU.
"C:\Program Files (x86)\Intel\oneAPI\vtune\2022.0.0\bin64\vtune" -collect hotspots -app-working-dir C:\Users\dahub\source\repos\DPCPPConsoleApplication1\DPCPPConsoleApplication2\ --app-working-dir=C:\Users\dahub\source\repos\DPCPPConsoleApplication1\DPCPPConsoleApplication2\ -- C:\Users\dahub\source\repos\DPCPPConsoleApplication1\x64\Release\DPCPPConsoleApplication2.exe
and the output remains the same with it reporting an exception relating to host memory in openCL.
- Mark as New
- Bookmark
- Subscribe
- Mute
- Subscribe to RSS Feed
- Permalink
- Report Inappropriate Content
Hi,
Sorry for the delay.
We are working on this. We will get back to you soon.
Regards,
Janani Chandran
- Mark as New
- Bookmark
- Subscribe
- Mute
- Subscribe to RSS Feed
- Permalink
- Report Inappropriate Content
Hi,
Good day to you.
Sorry for the delay, please follow the below workaround. (Please install OneAPI Base toolkit)
Workaround:
1. Open command prompt as an administrator and run the below command
set environmental variables:
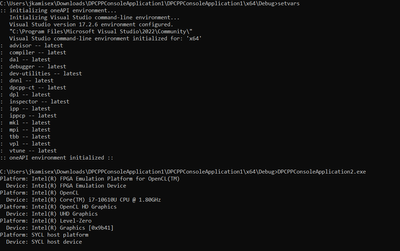
C:\Program Files (x86)\Intel\oneAPI\setvars.bat
2. Now run create an executable with below command (Go to DPCPPConsoleApplication2.cpp file directory with help of 'cd')
dpcpp DPCPPConsoleApplication2.cpp -o a.exe -EHsc
3. Now we created an executable with name 'a.exe', we need to profile this executable with the below command.
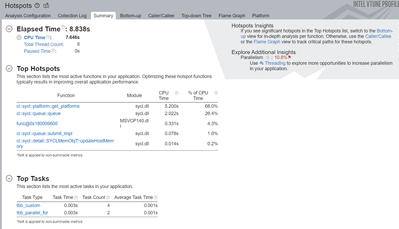
vtune -collect hotspots a.exe
4. Now, a result directory is going to be created in that path (eg: r000xx). Open those results in Vtune GUI which looks like below.
If this resolves your issue, make sure to accept this as a solution. This would help others with similar issue. Thank you!
Regards,
Jaideep
- Mark as New
- Bookmark
- Subscribe
- Mute
- Subscribe to RSS Feed
- Permalink
- Report Inappropriate Content
Hi,
If this resolves your issue, make sure to accept this as a solution. This would help others with similar issue. Thank you!
Thanks,
Jaideep
- Mark as New
- Bookmark
- Subscribe
- Mute
- Subscribe to RSS Feed
- Permalink
- Report Inappropriate Content
Hi,
We assume that your issue is resolved. If you need any additional information, please post a new question as this thread will no longer be monitored by Intel.
Regards,
Jaideep
- Subscribe to RSS Feed
- Mark Topic as New
- Mark Topic as Read
- Float this Topic for Current User
- Bookmark
- Subscribe
- Printer Friendly Page


