- Mark as New
- Bookmark
- Subscribe
- Mute
- Subscribe to RSS Feed
- Permalink
- Report Inappropriate Content
Hey Guys
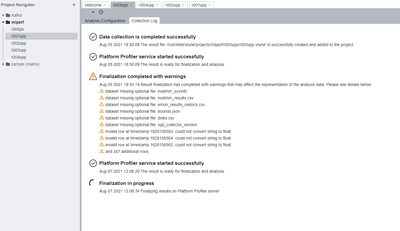
Running web UI for profiler , runs fine but when click on any report , its hangs on generating data
[root@node1 bin64]# ./vtune-backend --web-port=8080 --allow-remote-ui
Below are the errors from cmd line
[root@node1 bin64]# ./vtune-backend --web-port=8080 --allow-remote-ui
No TLS certificate was provided as a --tls-certificate command-line argument thus a self-signed certificate is generated to enable secure HTTPS transport for the web server: /root/.intel/vtune/settings/certificates/middleware.crt.
Serving GUI at https://node1:8080
Serving GUI at https://xx.xx.xx.xx:8080
warn: CSP violation reported {
'csp-report': {
'document-uri': 'https://xx.xx.xx.xx:8080/ui/',
referrer: '',
'violated-directive': 'script-src',
'effective-directive': 'script-src',
'original-policy': "connect-src 'self' software.intel.com wss: ws: ; frame-ancestors 'self' ; script-src 'self' ; style-src 'self' 'unsafe-inline' ; img-src 'self' blob: * ; font-src 'self' data: * ; child-src 'self' blob: *; default-src 'self' ; report-uri https://xx.xx.xx.xx:8080/cspreports",
disposition: 'enforce',
'blocked-uri': 'eval',
'line-number': 1,
'column-number': 93307,
'source-file': 'https://xx.xx.xx.xx:8080/vendor-618723.js',
'status-code': 200,
'script-sample': ''
}
}
error: [
{
type: 'error',
text: 'Data source error: gen_helpers2::error_code_t datasrc1::RequestDispatcher::handleRequest(const std::__cxx11::basic_string<char, std::char_traits<char>, std::allocator<char>> &, const gen_helpers2::variant_bag_t &, gen_helpers2::variant_bag_t &, msngr2::IProgress *): IsNot Valid Parameter(result:info)'
},
'%s:'
]
Link Copied
- Mark as New
- Bookmark
- Subscribe
- Mute
- Subscribe to RSS Feed
- Permalink
- Report Inappropriate Content
[root@node1 bin64]# ./vtune-self-checker.sh
Intel(R) VTune(TM) Profiler Self Check Utility
Copyright (C) 2009-2020 Intel Corporation. All rights reserved.
Build Number: 618723
HW event-based analysis (counting mode)
Example of analysis types: Performance Snapshot
Collection: Ok
Finalization: Ok...
Report: Ok
Instrumentation based analysis check
Example of analysis types: Hotspots and Threading with user-mode sampling
Collection: Ok
vtune: Warning: Hardware collection of CPU events is not possible on this system. Microarchitecture performance insights will not be available.
Finalization: Ok...
Report: Ok
HW event-based analysis check
Example of analysis types: Hotspots with HW event-based sampling, HPC Performance Characterization, etc.
Collection: Fail
vtune: Warning: To profile kernel modules during the session, make sure they are available in the /lib/modules/kernel_version/ location.
vtune: Error: Failed to execute sep process. Data collection is interrupted.
HW event-based analysis check
Example of analysis types: Microarchitecture Exploration
Collection: Fail
vtune: Warning: CPU frequency data collection is not supported on this platform.
vtune: Warning: To profile kernel modules during the session, make sure they are available in the /lib/modules/kernel_version/ location.
vtune: Error: Failed to execute sep process. Data collection is interrupted.
HW event-based analysis with uncore events
Example of analysis types: Memory Access
Collection: Fail
vtune: Error: Memory Access analysis is not supported inside a virtual machine since uncore events cannot be collected. For full functionality, consider using a bare-metal environment.
HW event-based analysis with stacks
Example of analysis types: Hotspots with HW event-based sampling and call stacks
Collection: Fail
vtune: Warning: To profile kernel modules during the session, make sure they are available in the /lib/modules/kernel_version/ location.
vtune: Error: Failed to execute sep process. Data collection is interrupted.
HW event-based analysis with context switches
Example of analysis types: Threading with HW event-based sampling
Collection: Fail
vtune: Warning: Context switch data cannot be collected using the Perf-based driverless collection if the kernel version is less than 4.3. Consider loading the VTune Profiler sampling driver using the root credentials.
vtune: Warning: CPU frequency data collection is not supported on this platform.
vtune: Warning: To profile kernel modules during the session, make sure they are available in the /lib/modules/kernel_version/ location.
vtune: Error: Failed to execute sep process. Data collection is interrupted.
Checking DPC++ application as prerequisite for GPU analyses: Fail
Unable to run DPC++ application on GPU connected to this system. If you are using an Intel GPU and want to verify profiling support for DPC++ applications, check these requirements:
* Install Intel(R) GPU driver.
* Install Intel(R) Level Zero GPU runtime.
* Install Intel(R) oneAPI DPC++ Runtime and set the environment.
The check observed a product failure on your system.
Review errors in the output above to fix a problem or contact Intel technical support.
The system is ready for the following analyses:
* Performance Snapshot
* Hotspots and Threading with user-mode sampling
The following analyses have failed on the system:
* Hotspots with HW event-based sampling, HPC Performance Characterization, etc.
* Microarchitecture Exploration
* Memory Access
* Hotspots with HW event-based sampling and call stacks
* Threading with HW event-based sampling
* GPU Compute/Media Hotspots (characterization mode)
* GPU Compute/Media Hotspots (source analysis mode)
Log location: /tmp/vtune-tmp-root/self-checker-2021.08.06_16.24.40/log.txt
- Mark as New
- Bookmark
- Subscribe
- Mute
- Subscribe to RSS Feed
- Permalink
- Report Inappropriate Content
Can you please provide more detailed scenario. Are you trying to open a precollected result in browser?
Please also elaborate on the hang on generating data - how does it look like? Probably the screenshot would help.
Thanks,
Alyona.
- Mark as New
- Bookmark
- Subscribe
- Mute
- Subscribe to RSS Feed
- Permalink
- Report Inappropriate Content
- Trying to open from other systems using browser
- When 2 or more users trying to open reports using browser
- Mark as New
- Bookmark
- Subscribe
- Mute
- Subscribe to RSS Feed
- Permalink
- Report Inappropriate Content
Hi,
I see that the data finalization completed once on Aug 05, 18:54:19 - were you able to view the result after that? Do the results appear after a hang?
- Mark as New
- Bookmark
- Subscribe
- Mute
- Subscribe to RSS Feed
- Permalink
- Report Inappropriate Content
Hi,
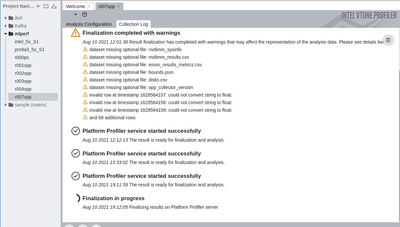
Check below latest screenshot , its stuck at finalizing the results . I got the results few hrs back , that time i was able to see the report and now its stuck at this screen. This shot has been taken from Vtune server using vtune-gui . The localhost is not able to process the results , its strange.
- Mark as New
- Bookmark
- Subscribe
- Mute
- Subscribe to RSS Feed
- Permalink
- Report Inappropriate Content
Hi,
Sorry for the late reply. We tried running vtune-backend and we didn't get any error.We tried in oneapi devcloud with vtune 2021.6.0.If you are still not able to connect through web server make sure you have tried these steps:
1)Go to the path 'vtune/latest/bin64/'
2)Execute the command 'vtune-backend --web-port=8080 '
3)After this URL will be generated. Do the tunneling steps if required.
4)Open the URL from browser.
5)If you are trying it for the first time you will be asked for passphrase.
6)After this VTune profiler will be opened and you can proceed with the analysis.
Please find the below link for reference :
Could you please share with us the results folder and the configuration snapshot of the analysis you are running in the VTune GUI in local host?
Thanks and Regards
Rahul
- Mark as New
- Bookmark
- Subscribe
- Mute
- Subscribe to RSS Feed
- Permalink
- Report Inappropriate Content
Hi,
We haven't heard back anything from you. Could you please confirm if the issue is resolved.
Thanks
- Mark as New
- Bookmark
- Subscribe
- Mute
- Subscribe to RSS Feed
- Permalink
- Report Inappropriate Content
thanks , its done
- Mark as New
- Bookmark
- Subscribe
- Mute
- Subscribe to RSS Feed
- Permalink
- Report Inappropriate Content
Hi,
Glad to know that your issue is resolved. If you need any additional information, please submit a new question as this thread will no longer be monitored.
Thanks and Regards
Rahul
- Subscribe to RSS Feed
- Mark Topic as New
- Mark Topic as Read
- Float this Topic for Current User
- Bookmark
- Subscribe
- Printer Friendly Page

