- Mark as New
- Bookmark
- Subscribe
- Mute
- Subscribe to RSS Feed
- Permalink
- Report Inappropriate Content
Hi All
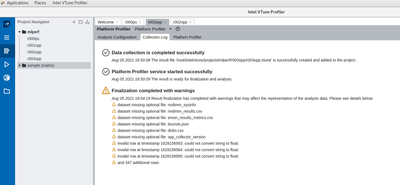
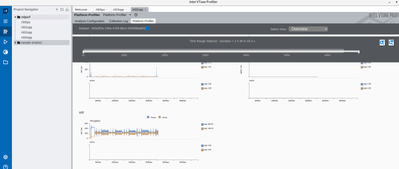
I am using remote target to collect information from a linux centos 8 system . I am selecting system profiler and generating report . The collection is successful , CPU , DRAM , Network all are showing nearly all metrices but for Disks , sda sdb , sdd etc , its only showing throughput . Also I see some warnings while logs collection and report generation . Attaching the screen captures for the same . please guide me and let me know if more info needed .
Link Copied
- Mark as New
- Bookmark
- Subscribe
- Mute
- Subscribe to RSS Feed
- Permalink
- Report Inappropriate Content
[root@node1 bin64]# ./vtune-self-checker.sh
Intel(R) VTune(TM) Profiler Self Check Utility
Copyright (C) 2009-2020 Intel Corporation. All rights reserved.
Build Number: 618723
HW event-based analysis (counting mode)
Example of analysis types: Performance Snapshot
Collection: Ok
Finalization: Ok...
Report: Ok
Instrumentation based analysis check
Example of analysis types: Hotspots and Threading with user-mode sampling
Collection: Ok
vtune: Warning: Hardware collection of CPU events is not possible on this system. Microarchitecture performance insights will not be available.
Finalization: Ok...
Report: Ok
HW event-based analysis check
Example of analysis types: Hotspots with HW event-based sampling, HPC Performance Characterization, etc.
Collection: Fail
vtune: Warning: To profile kernel modules during the session, make sure they are available in the /lib/modules/kernel_version/ location.
vtune: Error: Failed to execute sep process. Data collection is interrupted.
HW event-based analysis check
Example of analysis types: Microarchitecture Exploration
Collection: Fail
vtune: Warning: CPU frequency data collection is not supported on this platform.
vtune: Warning: To profile kernel modules during the session, make sure they are available in the /lib/modules/kernel_version/ location.
vtune: Error: Failed to execute sep process. Data collection is interrupted.
HW event-based analysis with uncore events
Example of analysis types: Memory Access
Collection: Fail
vtune: Error: Memory Access analysis is not supported inside a virtual machine since uncore events cannot be collected. For full functionality, consider using a bare-metal environment.
HW event-based analysis with stacks
Example of analysis types: Hotspots with HW event-based sampling and call stacks
Collection: Fail
vtune: Warning: To profile kernel modules during the session, make sure they are available in the /lib/modules/kernel_version/ location.
vtune: Error: Failed to execute sep process. Data collection is interrupted.
HW event-based analysis with context switches
Example of analysis types: Threading with HW event-based sampling
Collection: Fail
vtune: Warning: Context switch data cannot be collected using the Perf-based driverless collection if the kernel version is less than 4.3. Consider loading the VTune Profiler sampling driver using the root credentials.
vtune: Warning: CPU frequency data collection is not supported on this platform.
vtune: Warning: To profile kernel modules during the session, make sure they are available in the /lib/modules/kernel_version/ location.
vtune: Error: Failed to execute sep process. Data collection is interrupted.
Checking DPC++ application as prerequisite for GPU analyses: Fail
Unable to run DPC++ application on GPU connected to this system. If you are using an Intel GPU and want to verify profiling support for DPC++ applications, check these requirements:
* Install Intel(R) GPU driver.
* Install Intel(R) Level Zero GPU runtime.
* Install Intel(R) oneAPI DPC++ Runtime and set the environment.
The check observed a product failure on your system.
Review errors in the output above to fix a problem or contact Intel technical support.
The system is ready for the following analyses:
* Performance Snapshot
* Hotspots and Threading with user-mode sampling
The following analyses have failed on the system:
* Hotspots with HW event-based sampling, HPC Performance Characterization, etc.
* Microarchitecture Exploration
* Memory Access
* Hotspots with HW event-based sampling and call stacks
* Threading with HW event-based sampling
* GPU Compute/Media Hotspots (characterization mode)
* GPU Compute/Media Hotspots (source analysis mode)
Log location: /tmp/vtune-tmp-root/self-checker-2021.08.06_16.24.40/log.txt
- Mark as New
- Bookmark
- Subscribe
- Mute
- Subscribe to RSS Feed
- Permalink
- Report Inappropriate Content
Hi,
Thanks for reaching out to us.
Could you please share the result folder and the version of vtune?
Thanks.
- Mark as New
- Bookmark
- Subscribe
- Mute
- Subscribe to RSS Feed
- Permalink
- Report Inappropriate Content
Hi ,
Vtune profiler version - 2021.6.0
Product Build - 618723
Attached Results Folder
- Mark as New
- Bookmark
- Subscribe
- Mute
- Subscribe to RSS Feed
- Permalink
- Report Inappropriate Content
Hi,
Thanks for sharing the details, We are trying to reproduce the issue, will get back to you soon with an update.
Thanks.
- Mark as New
- Bookmark
- Subscribe
- Mute
- Subscribe to RSS Feed
- Permalink
- Report Inappropriate Content
Hi Team
Any update ??
- Mark as New
- Bookmark
- Subscribe
- Mute
- Subscribe to RSS Feed
- Permalink
- Report Inappropriate Content
Hi,
I'm debugging this issue. Could you please share with us the logs under <user_that_installed_vtune_home_directory>/intel/vtune_platform_profiler/logs too?
- Mark as New
- Bookmark
- Subscribe
- Mute
- Subscribe to RSS Feed
- Permalink
- Report Inappropriate Content
Hi,
PFA
- Mark as New
- Bookmark
- Subscribe
- Mute
- Subscribe to RSS Feed
- Permalink
- Report Inappropriate Content
Hi Karan,
I escalated this issue to development. I will let you know as soon as I get any information.
Thank you!
- Mark as New
- Bookmark
- Subscribe
- Mute
- Subscribe to RSS Feed
- Permalink
- Report Inappropriate Content
Thanks buddy , just waiting for the fix
- Mark as New
- Bookmark
- Subscribe
- Mute
- Subscribe to RSS Feed
- Permalink
- Report Inappropriate Content
Hi Karan,
After reproducing what you see and looking at the collection results, I observed that there is no activity reported for disks sdb and sdd. There is some activity collected for disk sda and the graphs in the Disk - Device view (from the top right drop down menu) reflect that activity. Do you know if your workload is using those disks? All activity related to disks may be taking place in sda and this is why no information is displayed for sdb and sdd. However, I'm investigating why there's no information displayed for IOPS even for sda.
- Mark as New
- Bookmark
- Subscribe
- Mute
- Subscribe to RSS Feed
- Permalink
- Report Inappropriate Content
Hey Mariana,
So my real issue is even you see disk activity in sda , there is no metrics related to IOPS , latency , blk size etc for sda .
- Mark as New
- Bookmark
- Subscribe
- Mute
- Subscribe to RSS Feed
- Permalink
- Report Inappropriate Content
Hi Karan,
I got reply from our developers:
"The information reported as missing in this case is expected behavior and this is not a bug."
Thanks!
- Mark as New
- Bookmark
- Subscribe
- Mute
- Subscribe to RSS Feed
- Permalink
- Report Inappropriate Content
Hi Karan,
According to our developers this issue is not a bug and we will no longer respond to this thread. If you require additional assistance from Intel, please start a new thread. Any further interaction in this thread will be considered community only.
Thanks!
- Subscribe to RSS Feed
- Mark Topic as New
- Mark Topic as Read
- Float this Topic for Current User
- Bookmark
- Subscribe
- Printer Friendly Page


